


The GBP/USD pair traded in different directions in the range of 1.1960 and 1.2050 and closed the day without significant changes.
Today it was also trading in a narrow price of 1.2050, staying close to last week's closing price.
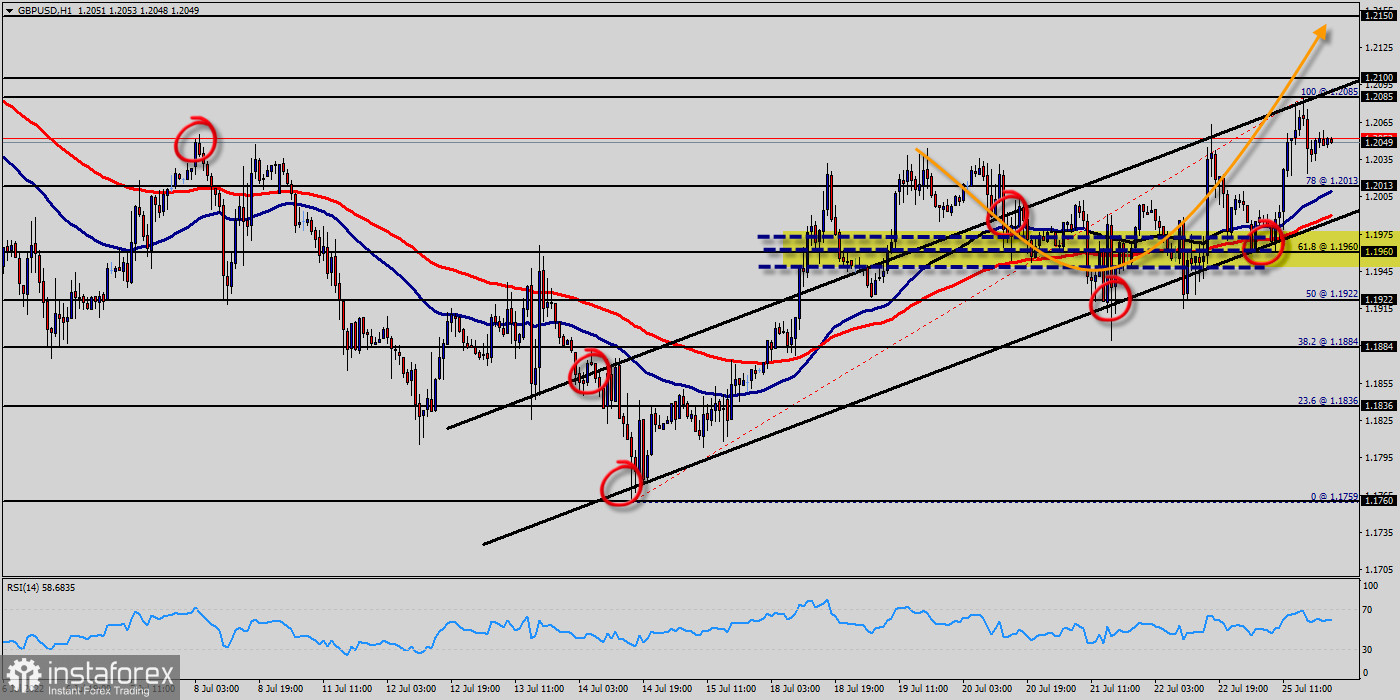
Intraday bias in the GBP/USD pair remains neutral as range trading continues.
Further rise is in favor as long as 1.1960 minor support holds. Above 1.1960 minor support will target 1.2085 resistance turned support.
On the hourly chart, the GBP/USD pair is still testing resistance - the moving average line MA (100) H1 (1.2050). On the four-hour chart, the GBP/USD pair is still above the MA 100 H4 line.
Continuing for breaking there will bring stronger rebound back to channel resistance (now at 1.2050).
The GBP/USD pair broke resistance which turned to strong support at the level of 1.0120 yesterday.
The level of 1.1960 coincides with a golden ratio (61.8% of Fibonacci), which is expected to act as major support today.
The Relative Strength Index (RSI) is considered overbought because it is above 50. The RSI is still signaling that the trend is upward as it is still strong above the moving average (100).
This suggests the pair will probably go up in coming hours. Accordingly, the market is likely to show signs of a bullish trend.
Buy orders are recommended above 1.2050 with the first target at the level of 1.2085.
From this point, the pair is likely to begin an ascending movement to the point of 1.2085 and further to the level of 1.2100.
The level of 1.2100 will act as strong resistance and the double top is already set at the point of 1.2085.
On the downside, below 1.2100 will bring retest of 1.2013 low instead.
If the GBP/USD pair fails to break through the resistance level of 1.2100, the market will decline further to 1.2013.
This would suggest a bearish market because the RSI indicator is still in a positive area and does not show any trend-reversal signs.
The pair is expected to drop lower towards at least 1.1960 with a view to test the daily pivot point.


