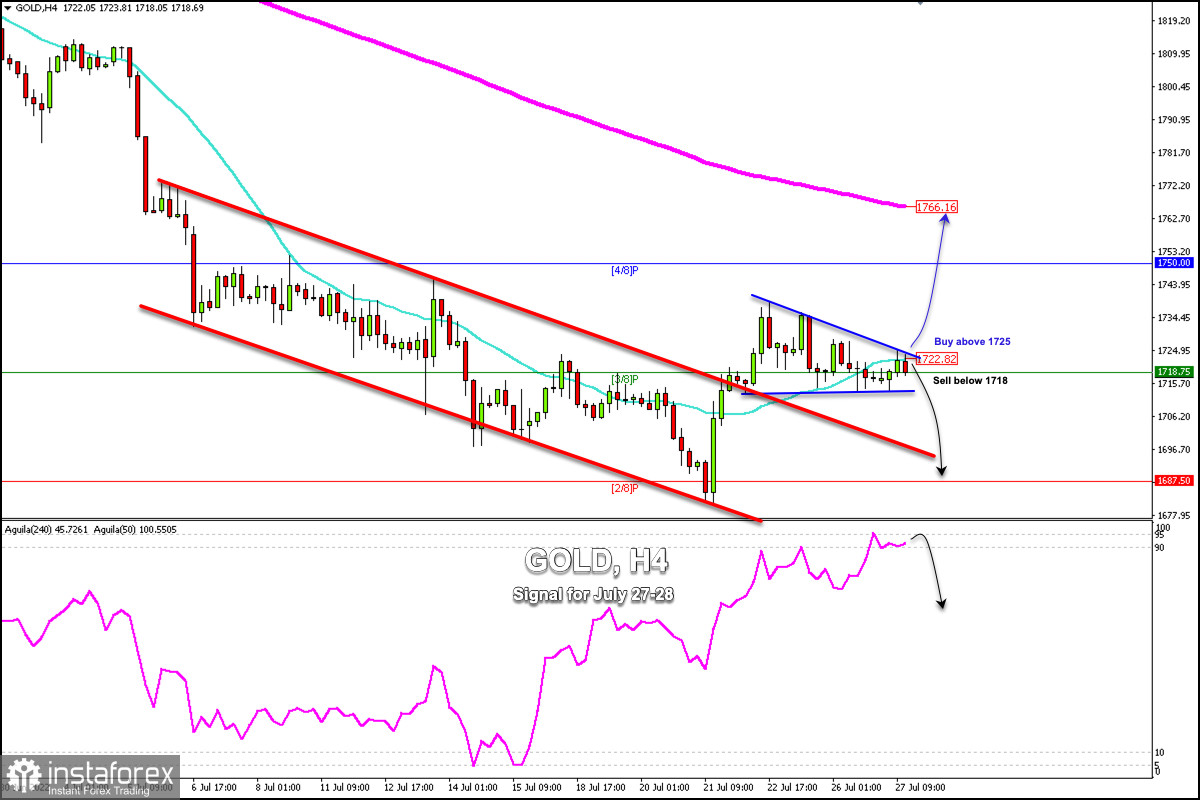
Early in the American session, gold is trading below the 21 SMA located at 1,722 and inside the symmetrical triangle formed on July 21st.
Investors are awaiting the important information that will be unveiled in the afternoon of the American session at 18:00 GMT. Powell will give a press conference that could fuel strong market volatility. The high-impact policy decision will define the trend in the coming weeks.
The Federal Reserve is expected to raise the interest rate by 0.75% to 2.50%. It is expected to generate a significant impact on financial markets. Gold as a safe-haven asset could suffer strong volatility. If the US dollar appreciates alongside Treasury bond yields, XAU/USD could fall towards the zone of 1,687 (2/8 Murray).
Gold has found support at 1,718 which coincides with the zone of 3/8 Murray. In case of bouncing above this level, gold could gain momentum and could break the top of the downtrend channel represented by the symmetrical triangle.
A close and consolidation above 1,725 on the 4-hour chart could mean a resumption of the bullish sequence and the price could quickly reach 4/8 Murray at 1,750 and could even reach 1,766 (200 EMA).
In the opposite scenario, in case gold trades below 1,718 (3/8 Murray) and the symmetrical triangle is broken, the price could fall rapidly towards 1,696 and even to 1,687 (2/8 Murray).
The market sentiment report shows that there is 87.26% of traders who are buying gold and 12.74% who are selling. Gold is likely to be in a tough spot for recovery. We could expect a pullback towards the 17,50 area or up to the 200 EMA at 1,766. Then, the price could resume its downtrend.
The eagle indicator has reached the extremely overbought zone and a technical correction is likely in the coming days if gold settles below 1,722.


