


The bullish trend is currently very strong for BTC/USD. As long as the price remains below the resistance at $ 22.688, it could try to take advantage of the bullish rally. The first bullish objective is located at $ 23,794.
Crossing it would then enable buyers to target $ 23,794. Be careful, given the powerful bearish rally underway, excesses could lead to a short-term rebound. If this is the case, remember that trading against the trend may be riskier. It would seem more convenient to wait for a signal indicating reversal of the trend.
Bitcoin has closed above the pivot point ($ 22.688) could assure that BTC/USD will move higher towards cooling new highs. The bulls must break through $ 22.688 in order to resume the up trend.
BTC/USD is at an all-time high against the dollar around the spot of $ 22k - $ 23k since a month. BTC/USD is inside in upward channel. Closing above the major support ($ 22.688) could assure that BTC/USD will move higher towards cooling new highs.
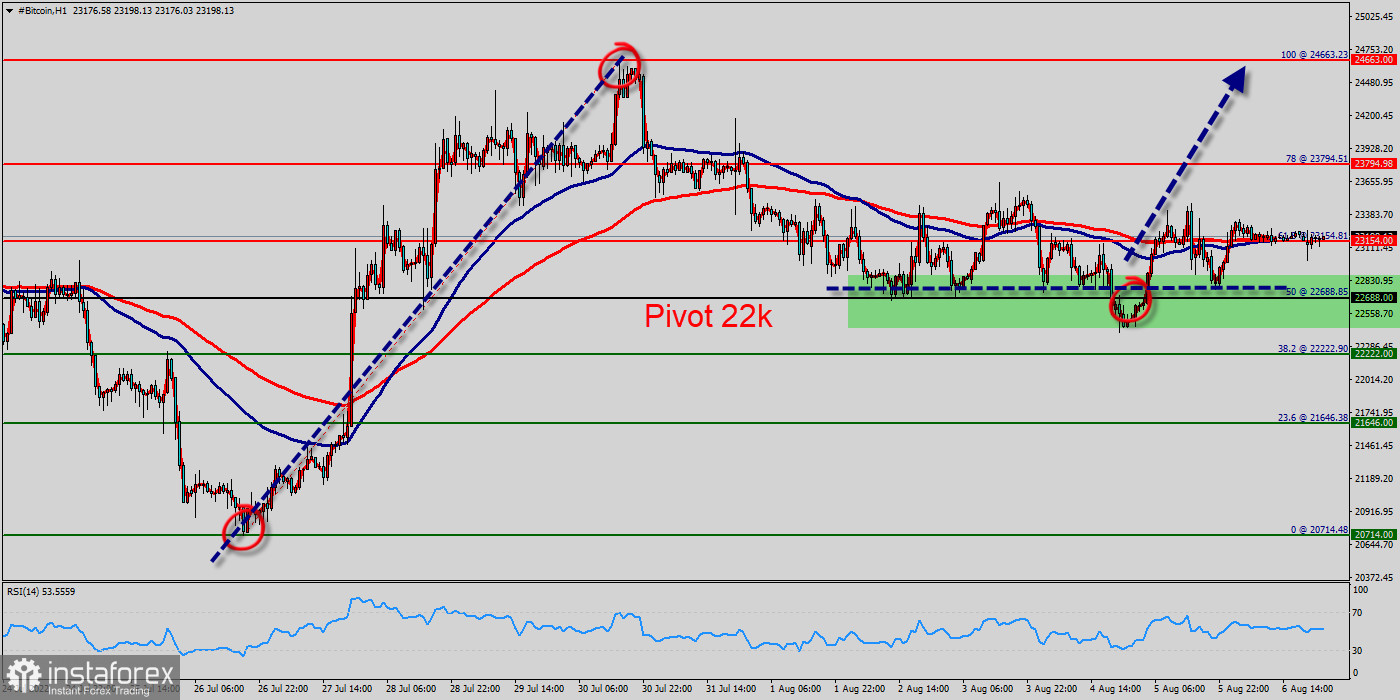
BTC/USD is continuing rising by market cap at a range between $ 22k and $ 23k. BTC/USD is trading at $23.154 after it reached $23.794 earlier. BTC/USD has been set above the strong support at the price of $ 22.688, which coincides with the 50% Fibonacci retracement level.
This support has been rejected three times confirming the veracity of an uptrend. The market is likely to show signs of a bullish trend around the spot of $23.154. Buy orders are recommended above the area of $23.154 with the first target at the price of $23.794; and continue towards $24.663 in order to test the last bullish wave.
The bullish momentum would be revived by a break in this resistance. Buyers would then use the next resistance located at $ 24,663 as an objective.
On the other hand , if the BTC/USD fails to break through the resistance price of $23.794 today, the market will decline further to $ 22.688 (return to pivot). In the very short term, the general bullish sentiment is not called into question, despite technical indicators being neutral (RSI).


