


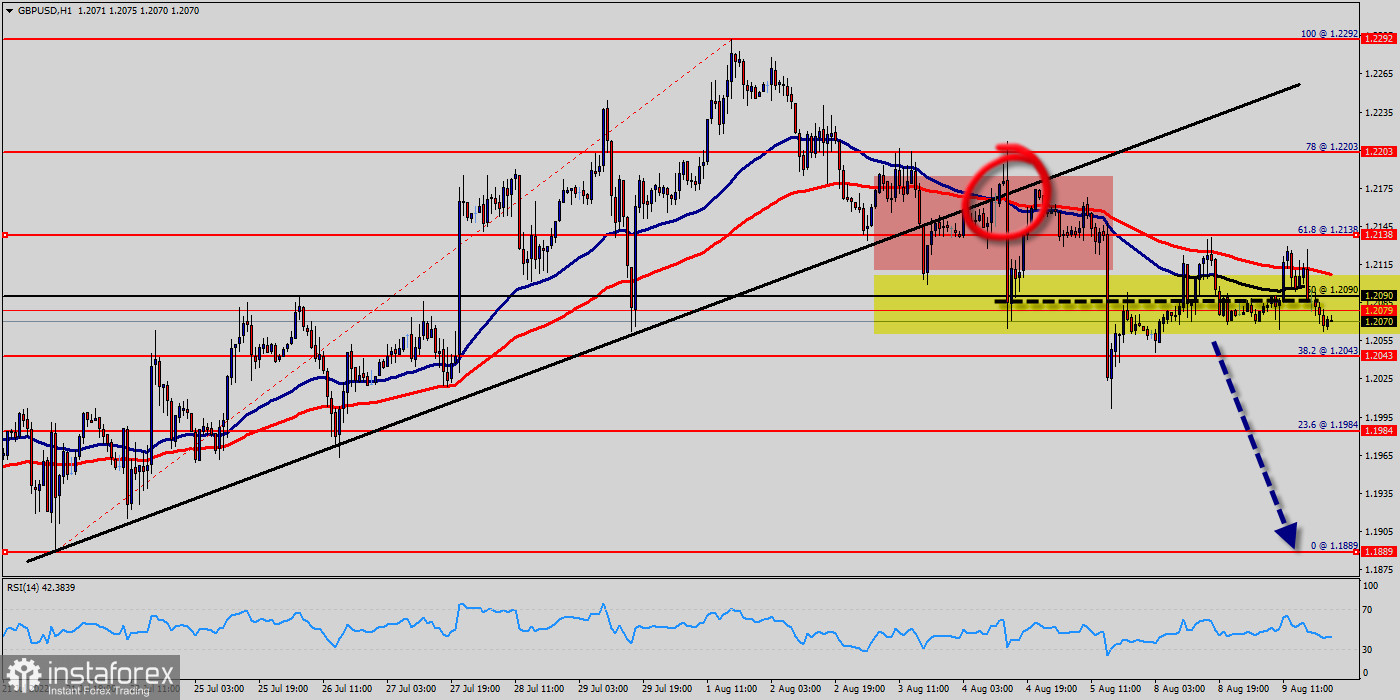
The basic trend is very bearish on the GBP/USD pair but buyers need to catch their breath in the short term. In a case like this, you could favour trades in the direction of the trend on the GBP/USD pair.
As long as you stay below the resistance 1.2090, sellers' retain the upper hand. A break in the support at 1.2043 would be a signal that the basic trend will reverse.
Currently, the price is in a bearish channel. This is confirmed by the RSI indicator signaling that we are still in a bullish trending market.
The bias remains bearish in the nearest term testing 1.2043 and 1.1984. Immediate resistance is seen around 1.2090 levels, which coincides with the weekly pivot.
Moreover, the moving average (100) starts signaling a downward trend; therefore, the market is indicating a bearish opportunity below 1.2090.
So it will be good to sell at 1.2090 with the first target of 1.2043. It will also call for a downtrend in order to continue towards 1.1984. The strong weekly support is seen at 1.1984.
Sellers would then use the next support located at 1.1984 as an objective. Crossing it would then enable sellers to target 1.1889.
If the price were to depress the resistance 1.2203 in the short term, this would be a sign of possible consolidation in the short term, but against the trend trading would then perhaps be more risky.
However, if a breakout happens at the resistance level of 1.2203, then this scenario may be invalidated. On the other hand, we could expect signals of a reversal of the trend.


