


The British pound has weakened against the US dollar since the beginning of this week (15th of August, 2022). That's the British pound (GBP) has fallen over 5% against the US dollar (USD) since the start of the week, which is significant, especially since these are the two major currencies of the world.
The drop has also concentrated in this week. The GBP/USD pair continues to move downwards from the level of 1.2228. Yesterday, the pair dropped from the level of 1.2228 (this level of 1.2228 coincides with the ratio of 78%) to the bottom around 1.2020. T
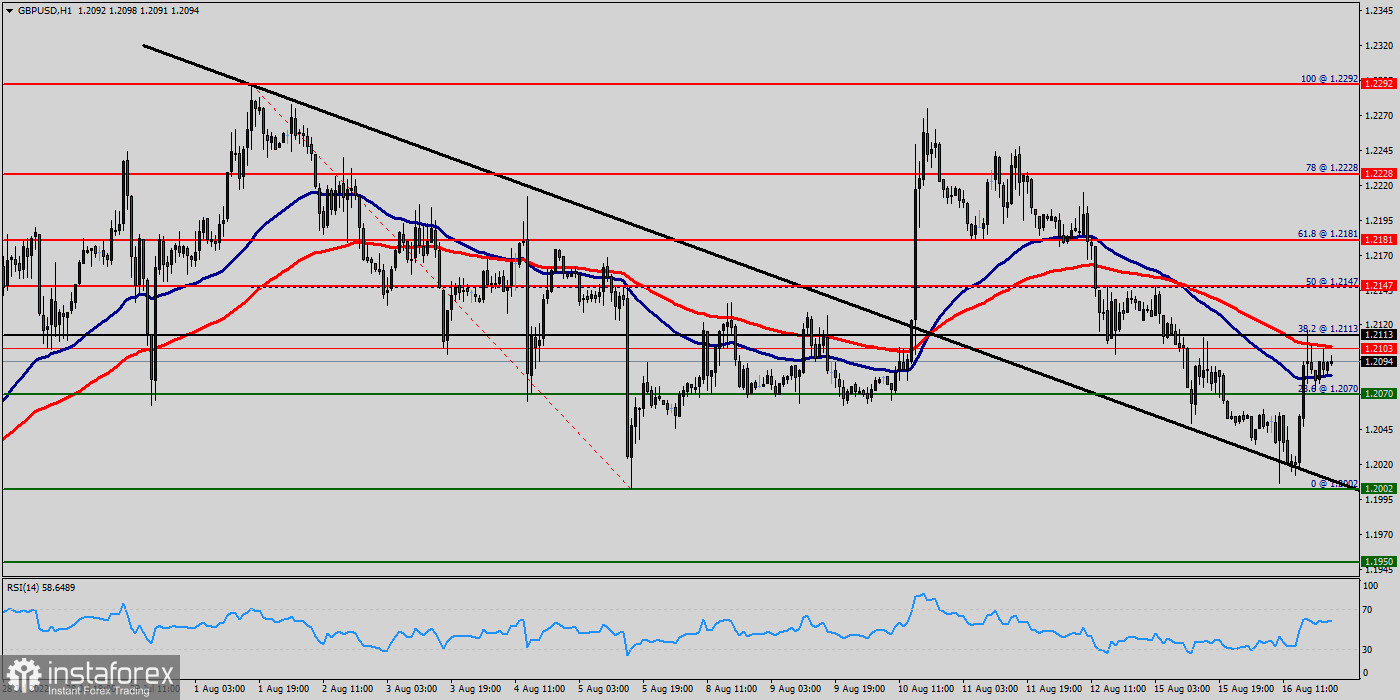
oday, the first resistance level is seen at 1.2147 followed by 1.2228, while daily support 1 is found at 1.2002.
Also, the level of 1.2113 represents a weekly pivot point for that it is acting as major resistance/support this week. The GBP/USD pair fell with UK inflation elevated and still rising, the cost of living crisis taking hold, growth slowing and ongoing Brexit woes, the outlook for the pound is deteriorating. Meanwhile, the USD is supported by safe-haven flows and hawkish Federal Reserve (Fed) bets.
Amid the previous events, the pair is still in a downtrend, because the GBP/USD pair is trading in a bearish trend from the new resistance line of 1.2113 towards the first support level at 1.2002 in order to test it.
If the pair succeeds to pass through the level of 1.2002, the market will indicate a bearish opportunity below the level of 1.1950.
The trend is still bearish as long as the price of 1.2113 is not broken. Thereupon, it would be wise to sell below the price of at 1.2113 with the primary target at 1.2002. Then, the GBP/USD pair will continue towards the second target at 1.1950.
The market is indicating a bearish opportunity below the above-mentioned support levels, for that the bearish outlook remains the same as long as the 100 EMA is headed to the downside.
Forecast :
Today, resistance is seen at the levels of 1.2113 and 1.2147. So, we expect the price to set below the strong resistance at the levels of 1.2113 and 1.2147; because the price is in a bearish channel now. The RSI starts signaling a downward trend. Consequently, the market is likely to show signs of a bearish trend. Thus, it will be good to sell below the level of 1.2113 with the first target at 1.2002 and further to 1.1950 in order to test the daily support. If the GBP/USD pair is able to break out the daily support at 1.1950, the market will decline further to 1.1900 to approach support 3 in coming hours or days. However, the price spot of 1.2147 remains a significant resistance zone. Therefore, the trend is still bearish as long as the level of 1.2147 is not breached.


