


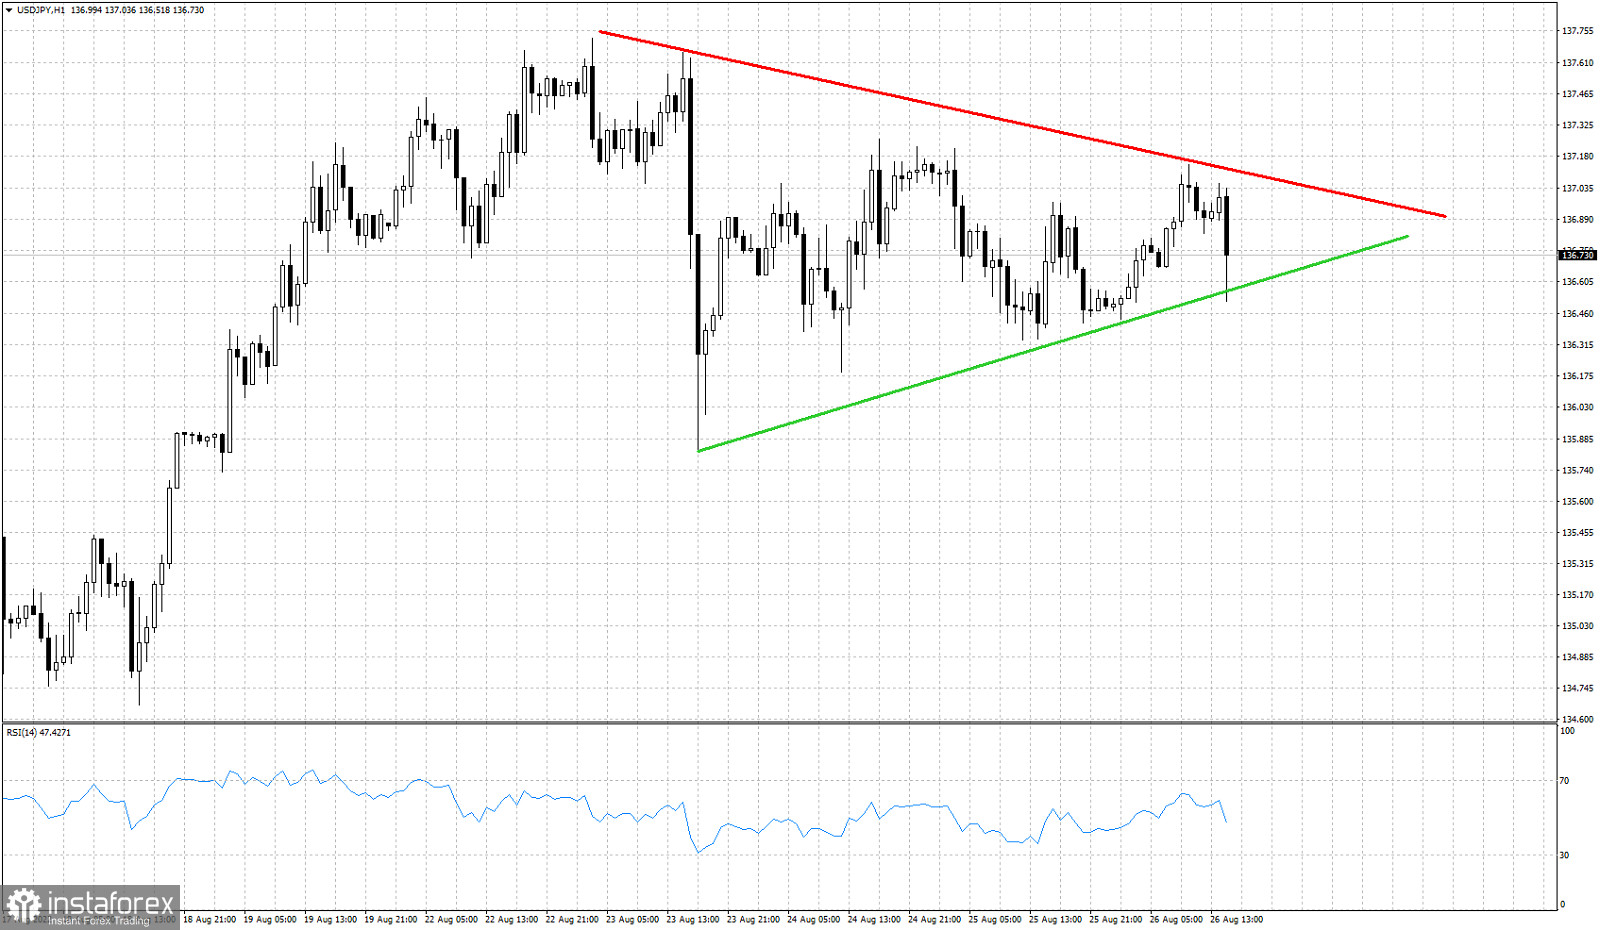
Red line - upper triangle boundary
Green line- lower triangle boundary
USDJPY is trading around 136.70 after bouncing higher towards 137.15 earlier today. Price has formed a triangle pattern and today's highs reached the upper triangle boundary resistance. Failure to break above resistance is a sign of weakness. The pull back after the rejection brought price at the lower triangle boundary support at 136.50. As we mentioned in our previous analysis, bears need to break below 136.40 in order to confirm the bearish scenario. As long as price holds above the green trend line, bulls have hopes for a move above 137.50 towards 138. USDJPY continues to respect the triangle boundaries and so traders need to be patient and cautious.


