EUR/USD - 24H.

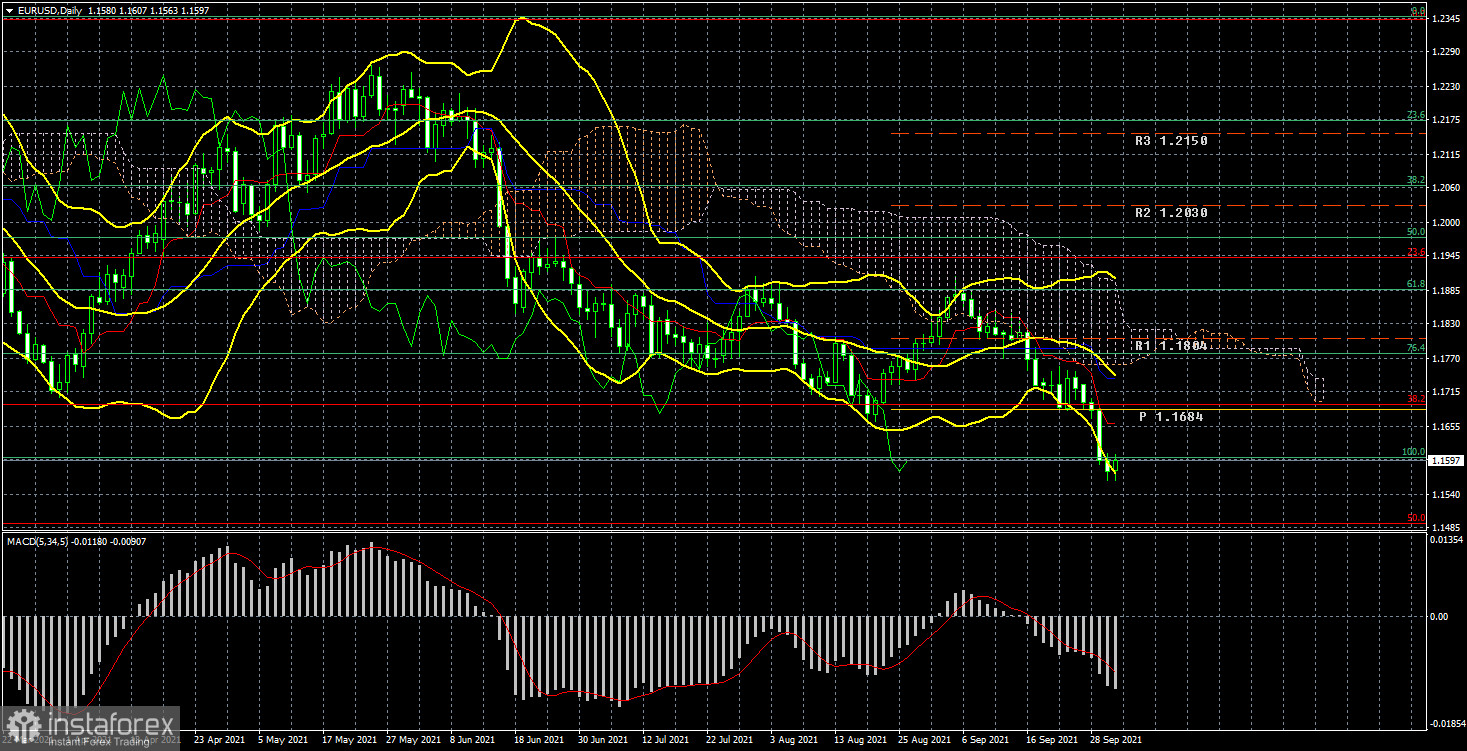
The EUR/USD currency pair has lost about 130 points during the current week, which is quite a lot for it, given its nature of movement in recent months. The most important thing is that traders have found reasons to overcome the 17th level after all. Thus, the euro quotes have already fallen to the 16th level and can now continue to fall. We have repeatedly noted that the level of 1.1700 is in some way a reference for the euro/dollar pair, and overcoming it will allow us to expect further movement to the south. So far, this option is being executed. In general, I would like to note that the pair's fall has been going on for about a month. And of the fundamental global factors that could play into the hands of the US currency, we see only an increased probability that the Fed will begin to curtail the quantitative stimulus program in 2021. This issue is very "thin" and "slippery" for the US dollar. It should be understood that the ECB is also considering ending QE. Most likely, both central banks will start winding down at about the same time. However, Christine Lagarde said last week that her department would reduce the pace of asset purchases in the third and fourth quarters. The ECB has already begun to wind down. After all, the Fed will not end its QE in one day either. Thus, the ECB began to be the first to refuse incentives, but for some reason, the dollar is getting more expensive. And from our point of view, the answer lies in the volume of QE. It's no secret that QE in the US is greater than QE in the European Union. Over the past year and a half, the money supply in the US has grown much more than in the EU. Thus, the rejection of larger monetary injections into the economy may play into the hands of the dollar since the European Union refuses smaller incentives. Powerful cash flows into the American economy are weakening, so the imbalance between the money supply in the EU and the US is slowly beginning to level out. It will begin to level off since, so far, the Fed is only talking about winding down. Nevertheless, traders may regard this moment as the dollar will become more expensive in the future, so they are "preparing a sleigh from the summer" and are already getting rid of the euro and buying the dollar.
COT report.

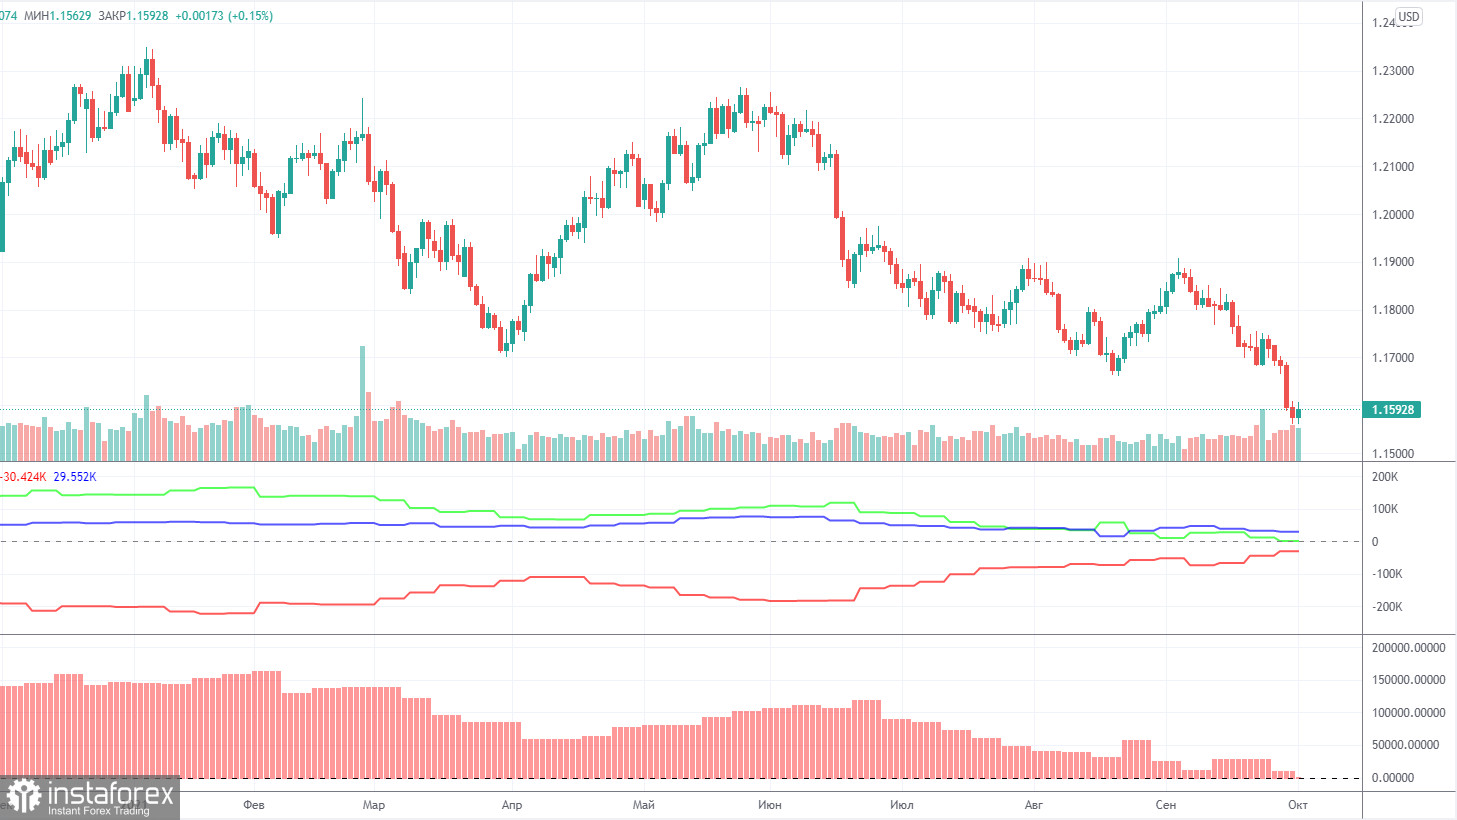
During the last reporting week (September 27 - October 1), the mood of non–commercial traders again became "less bullish." And in the near future, it may become fully "bearish" because, at the moment, the number of contracts for buying and selling from major players is almost the same. It means that at this time, the mood is "neutral," but this word does not accurately reflect what is happening in the market. According to the mood of professional traders, there is now a clear downward trend. Thus, the mood is not "neutral." During the reporting week, the Non-commercial group opened 7 thousand purchase contracts and 16 thousand sales contracts. Thus, the net position decreased by 9 thousand. We talked about in the previous paragraph: traders are currently actively getting rid of the euro and buying, respectively, the US dollar. Thus, at this time, the readings of the COT reports and the movement of the euro/dollar pair correlate. However, do not forget two important points. The first is that the Fed has not yet begun to wind down its QE. The second is that the current downward movement is still a correction against the global upward trend in which the pair has been for a year and a half. Thus, the "foundation" and COT reports allow us to assume that the euro's fall will continue. But, recall, each hypothesis, and assumption must be confirmed by specific technical signals. Now, these signals are there.
During the current trading week, all traders' attention was focused on the speeches of Christine Lagarde, Janet Yellen, and Jerome Powell. These officials spoke at least ten times during the week, but no really important information was received from them. Janet Yellen talked about the threat of a "technical default" and urged Congress to raise the debt ceiling as soon as possible. Jerome Powell talked about inflation and the fact that the labor market is still far from the levels of maximum employment. Christine Lagarde assured that inflation would begin to slow down, but it will happen later. In any case, all this information could hardly support the US currency. Thus, we believe that all these speeches did not affect the foreign exchange market in any way. The dollar is most likely growing based on the factor of the beginning of the curtailment of QE, possibly as early as November.
Trading plan for the week of October 4 - 8:
1) On the 24-hour timeframe, the upward trend has not changed since the bulls failed to develop success and overcome the level of 1.1886. At that moment, the pair resumed its downward movement and overcame the important levels of 1.17 and 1.16. Thus, the fall may continue next week with a target of 1.1490. This level is exactly 50% of the correction from the entire upward trend. Ichimoku and Bollinger Bands indicators also indicate a downward movement. Sales.
2) As for purchases of the euro/dollar pair, they should be considered no earlier than fixing the price above the critical line in the current conditions. And ideally - and above the Senkou Span line B. There are few prerequisites for a new upward trend to begin in the near future now.
Explanations to the illustrations:
Price levels of support and resistance (resistance /support), Fibonacci levels – target levels when opening purchases or sales. Take Profit levels can be placed near them.
Ichimoku indicators(standard settings), Bollinger Bands(standard settings), MACD(5, 34, 5).
Indicator 1 on the COT charts – the net position size of each category of traders.
Indicator 2 on the COT charts – the net position size for the "Non-commercial" group.


