Analysis of Friday deals:
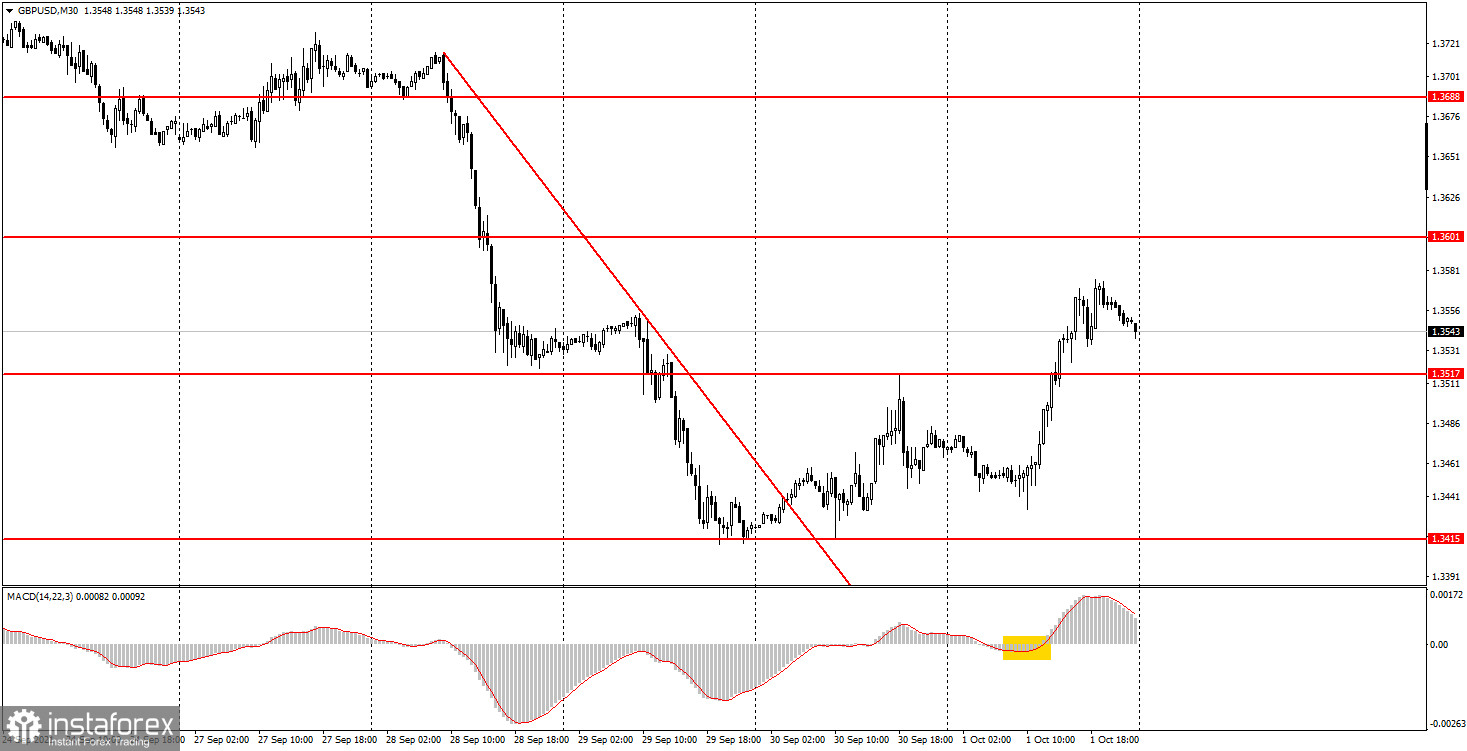
30M chart of the GBP/USD pair

The GBP/USD pair was actively moving on the 30-minute timeframe last Friday. Therefore, novice traders managed to make good money, but more on that below. After a disastrous first half of the week, the pound began to recover very quickly and by the end of Friday won back about half of its losses. Let us remind novice traders that the pound's fall was triggered by the news of the "fuel crisis" in the UK. Without going into details, it should be noted that this is an unprecedented phenomenon for a country like Britain, and at the same time very unexpected. Therefore, the markets could not help but react to it. Although, of course, it was impossible to predict it in advance. Nevertheless, in the last two trading days the pair has been actively recovering and this recovery cannot be attributed to macroeconomic statistics. Only one report was published in Britain on Friday, which could hardly have caused a movement of 130 points. And the US reports came out when more than half of the upward movement of the pair passed. Thus, if there was any influence, it was minimal. The British PMI (the first tick in the picture below) was better than expected, but not enough to make the pound cheer up. Therefore, most likely, the markets began to recover the pound themselves after such a strong fall. The movement intensified on the 30-minute timeframe, so the signals from the Ichimoku indicator could be considered. Last Friday, a strong buy signal was created in the form of an upward reversal of the indicator near the zero level. This buy signal made it possible to earn about 100 points of profit, as it was formed almost at the very beginning of the movement.
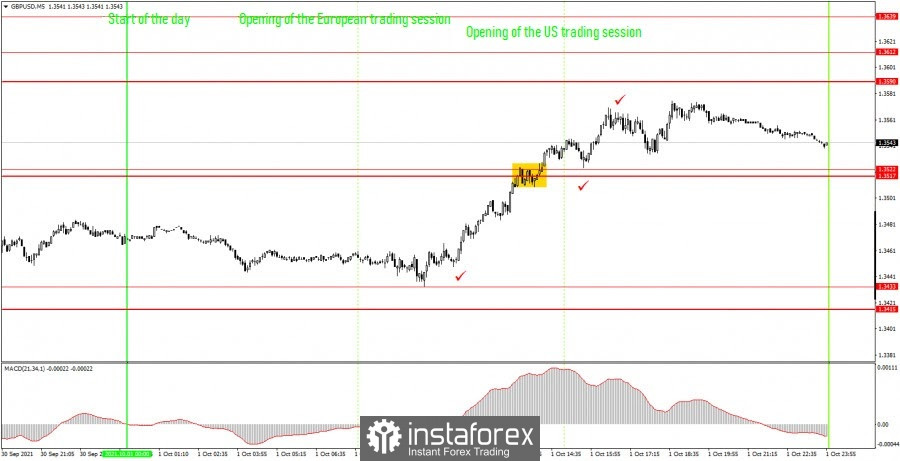
5M chart of the GBP/USD pair

It moved very well on the 5-minute timeframe on Friday and it is a pity that we could not "catch" this movement from the very beginning. On the other hand, we had a signal at the 30-minute TF, where we managed to "catch" the movement. In the morning, the price did not reach the level of 1.3415, only 18 points, and it has also not hit the level of 1.3433, since this is at least Friday. Thus, the first and only signal - to buy - was formed almost at the US trading session, when the price crossed the levels of 1.3517 and 1.3522. Here, novice traders could open long positions (if they missed the signal from the MACD), since the signal itself was strong enough. Subsequently, the price went up another 40 points, which was enough to trigger the minimum Take Profit, but did not reach the nearest level of 1.3590. Also, the deal could be manually closed in the late afternoon at a slightly lower profit. Thus, although we did not manage to work out the entire movement on the 5-minute TF, we still managed to make money.
How to trade on Monday:
There is no clear tendency at this time on the 30-minute timeframe. Nevertheless, the pair continues to move up after breaking the not strongest downtrend line. Therefore, formally, the trend is still upward, and the movement is quite strong. Therefore, it is possible to trade bullish using the signals of the MACD indicator. The important levels on the 5-minute timeframe are 1.3433, 1.3517, 1.3522, 1.3590, 1.3612. We recommend trading with them. The price can bounce off them or overcome them. As before, we set Take Profit at a distance of 40-50 points. At the 5M TF, you can use all the nearest levels as targets, but then you need to take profit, taking into account the strength of the movement. When passing 20 points in the right direction, we recommend setting Stop Loss to breakeven. There are no major events scheduled for Monday in the UK and the US, so you will have to trade exclusively on technical signals.
On the chart:
Support and Resistance Levels are the Levels that serve as targets when buying or selling the pair. You can place Take Profit near these levels.
Red lines are the channels or trend lines that display the current trend and show in which direction it is better to trade now.
The MACD indicator consists of a histogram and a signal line. When they cross, this is a signal to enter the market. It is recommended to use this indicator in combination with trend lines (channels and trend lines).
Important speeches and reports (always contained in the news calendar) can greatly influence the movement of a currency pair. Therefore, during their exit, it is recommended to trade as carefully as possible or exit the market in order to avoid a sharp price reversal against the previous movement.
Beginners on Forex should remember that not every single trade has to be profitable. The development of a clear strategy and money management are the key to success in trading over a long period of time.


