EUR/USD 5M

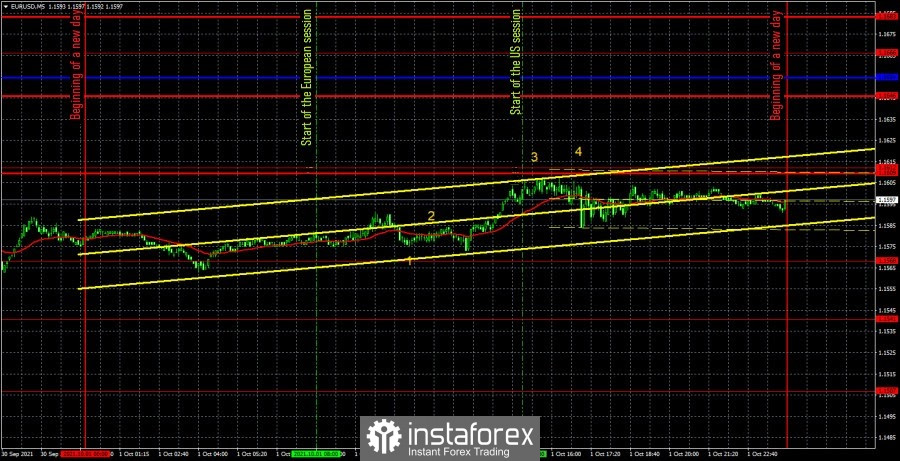
The EUR/USD pair traded rather sluggishly last Friday, passing only 44 points for the day. Despite the fact that there was a fairly large amount of macroeconomic statistics during the day, the markets did not find any good reason to work out most of it. The number "1" marks the time when the index of business activity in the production sector of the European Union was published. Number "2" - time of publication of the report on inflation in the European Union. Number "3" - data on changes in personal income and spending of the US population. The number "4" is the US ISM Manufacturing Index. As we warned on Friday, most of these reports can, as they say, "pass the market." And so it happened in practice. We expected that the European inflation report would still be worked out, especially since the actual value and the forecast did not coincide. However, traders only paid attention to the ISM report, which rose to 61.1 points, although forecasts spoke in favor of the decline. The pair went down 17 points after this report was published. Judge for yourself how much you can call a 17-point move a "reaction". In terms of trading signals, the picture was no better during the day. Simply put, not a single trading signal was generated during the day. The price reached and bounced off the extremum level of 1.1568 only in the evening, but since it was a night signal, we do not consider it and do not take it into account. And the pair did not reach a single important line or a single important level more than once during the day . Thus, since the downward trend at the hourly timeframe persists, the pair is now continuing a sluggish correction.
EUR/USD 1H

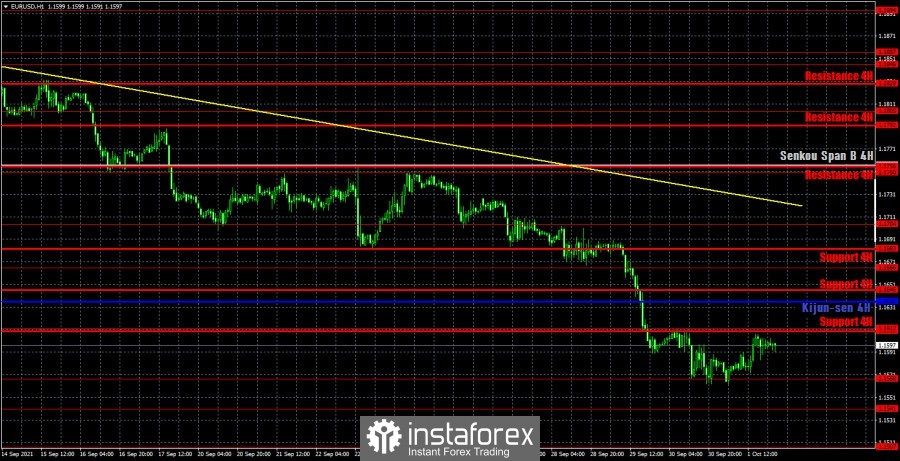
You see that the euro/dollar pair continues to move down on the hourly timeframe. However, the strong movement down very quickly came to naught and now the pair is moving in its usual manner, passing 40-50 points per day. Thus, the critical Kijun-sen line or even the trend line can now be the target for the correction. But in any case, the downward trend remains below the trend line, which means that selling is more preferable. On Monday, we highlight the following levels for trading - 1.1541, 1.1568, 1.1612, 1.1666, 1.1704, as well as the Senkou Span B (1.1754) and Kijun-sen (1.1636) lines. The Ichimoku indicator lines can change their position during the day, which should be taken into account when looking for trading signals. Signals can be rebounds or breakthroughs of these levels and lines. Do not forget about placing a Stop Loss order at breakeven if the price moves 15 points in the right direction. This will protect you against possible losses if the signal turns out to be false. No important macroeconomic reports on October 4. The calendars of events in the European Union and the United States are completely empty. As we said at the weekend, in principle, we can only expect the markets to react to statistics on Friday, and on the rest of the days, the markets will have to trade using pure technique, which is to some extent even good, since the US dollar has been rising in the last month, almost non-stop. Therefore, you need to understand whether the markets are tuned in to further short positions and what does this depend on? So far, the US currency is growing solely on expectations that the Fed will begin to phase out the QE program in November. But how much more will the dollar go up on this factor alone?
We also recommend that you familiarize yourself with the forecast and trading signals for the GBP/USD pair.
COT report

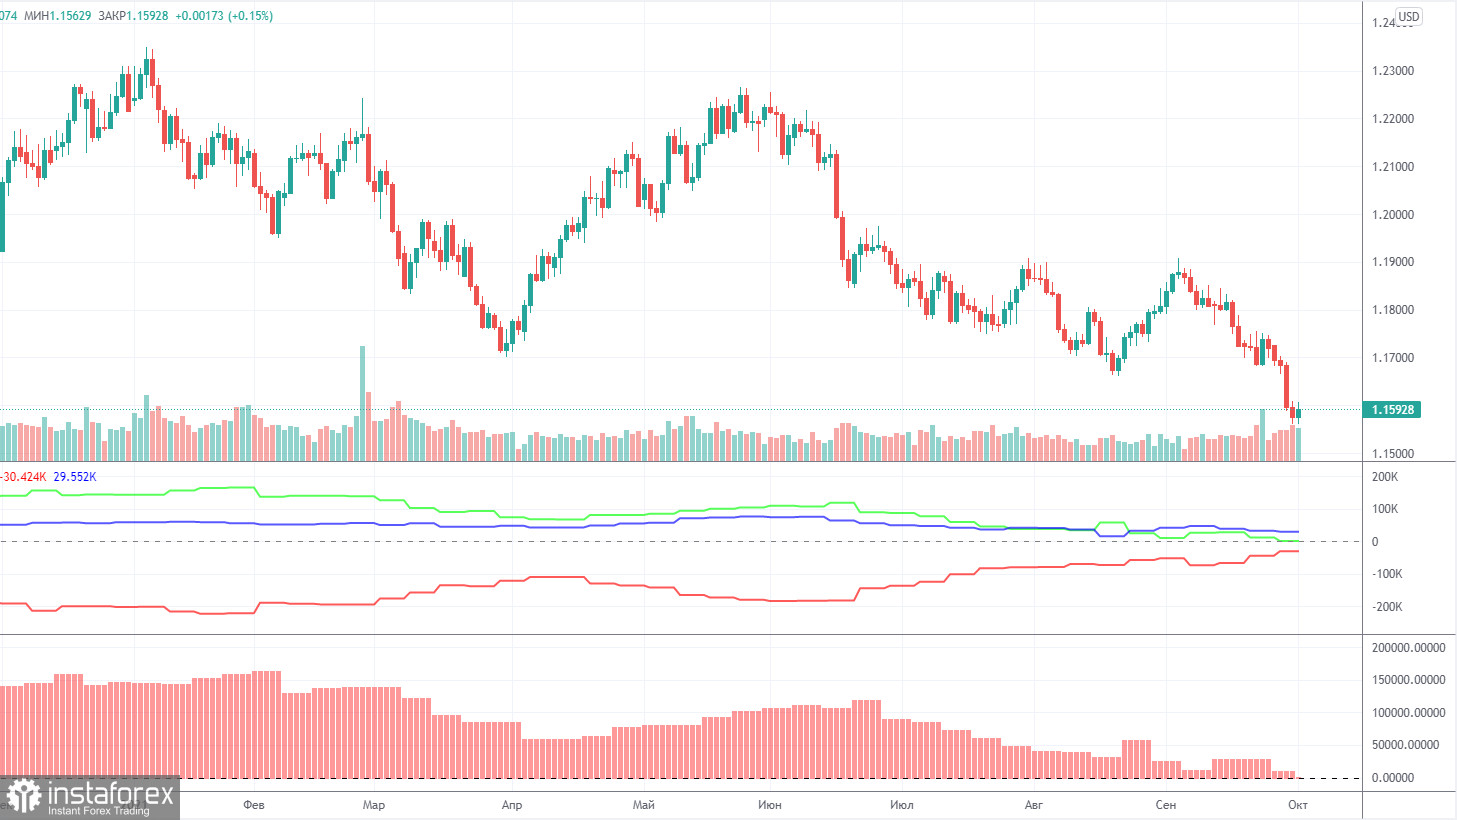
The mood of non-commercial traders became "less bullish" again during the last reporting week (September 21-27). And in the near future it may become fully bearish, because at the moment the number of buy and sell contracts for major players is practically the same. This means that the mood is "neutral" at this time, but this word does not accurately reflect what is happening in the market. According to the mood of professional traders, there is now a clear down trend. Thus, the mood is not "neutral". During the reporting week, the Non-commercial group opened 7,000 buy contracts (longs) and 16,000 sell contracts (shorts). Thus, the net position decreased by 9,000. This is exactly what we talked about in the previous paragraph: traders at this time are actively getting rid of the euro currency, and, accordingly, buy the US dollar. Thus, at this time, the readings of the COT reports and the movement of the EUR / USD pair have a correlation. However, there are two important points to keep in mind. First, the Federal Reserve has not yet begun to roll back its QE. The second - the current downward movement - is still a correction against the global uptrend, in which the pair has been for a year and a half. Thus, the "foundation" and the COT reports give us the opportunity to assume that the fall of the euro will continue. But, recall, each hypothesis and assumption must be confirmed by specific technical signals. Now these signals are there.
Explanations for the chart:
Support and Resistance Levels are the levels that serve as targets when buying or selling the pair. You can place Take Profit near these levels.
Kijun-sen and Senkou Span B lines are lines of the Ichimoku indicator transferred to the hourly timeframe from the 4-hour one.
Support and resistance areas are areas from which the price has repeatedly rebounded off.
Yellow lines are trend lines, trend channels and any other technical patterns.
Indicator 1 on the COT charts is the size of the net position of each category of traders.
Indicator 2 on the COT charts is the size of the net position for the non-commercial group.


