USD/JPY
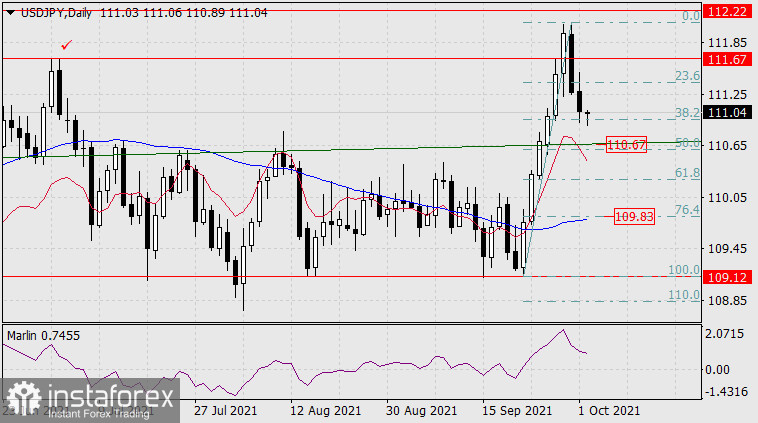
On the daily chart, the yen traded in the range of 23.6-38.2% Fibonacci levels on Friday, this morning the price visually intends to continue its path to the 50.0% Fibonacci level, which is located next to the trend line of the price channel at 110.67. The Marlin Oscillator has sharply turned to the downside, it is very likely that the price will overcome the immediate support and continue its way down to a deeper correction to the 76.4% Fibonacci level, near which the MACD line is located (109.83).

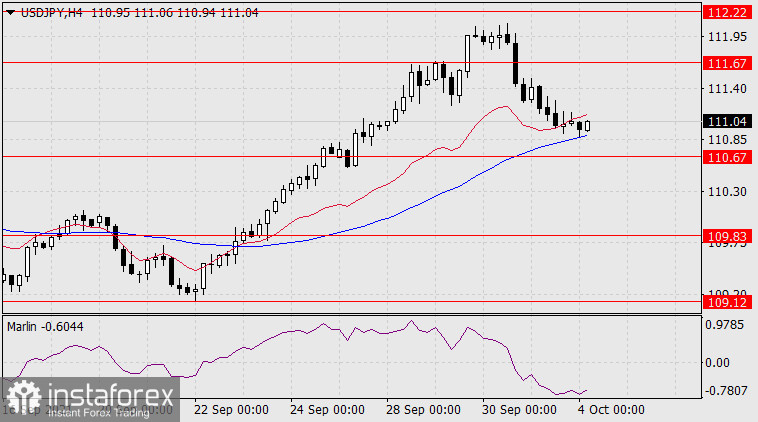
On the four-hour chart, the price in decline has reached the support of the MACD line. The 110.67 target level is a little below it. Overcoming the latter will be a signal for further downward movement of the USD/JPY pair.


