EUR/USD is confidently moving in a downtrend
Hello, dear colleagues!
Last week, the single European currency showed a steep decline against the US dollar. In general, the greenback advanced against a large number of currencies except for the Canadian and Australian dollars. As for the main currency pair of the forex market, it has lost 1.07% in the last five days. The US dollar was supported by higher US Treasury yields, investors' concerns about the spread of the COVID-19 pandemic, mixed macroeconomic indicators from China, as well as concerns about the US government debt and a possible government shutdown. All of these factors triggered the demand for the US dollar as a safe-haven asset and contributed to its strengthening.
Weekly chart

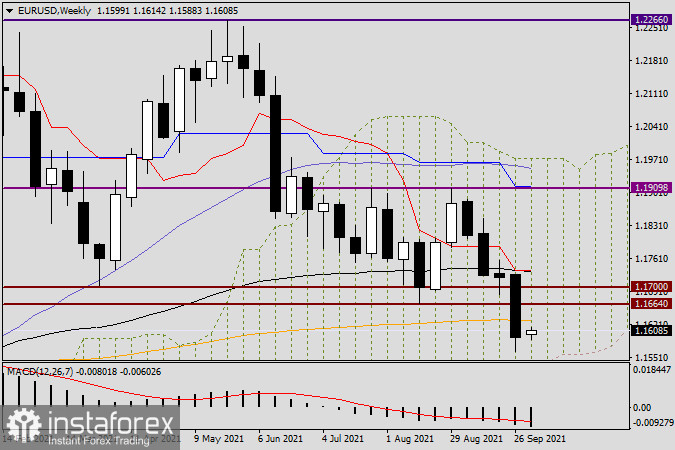
According to the weekly chart, the previous doji candlestick formed near the support level of 1.1664 failed to push the price up. The last major bearish candlestick located below the support level of 1.1664 and the orange 200-day exponential moving average indicated the market's intention to move downwards. During that decline, the pair almost touched the lower border of the Ichimoku cloud indicator, then rebounded from it, and closed at the level of 1.1592. Notably, this mark is below the important technical level of 1.1600. However, the quote has yet to fix below this mark and get out of the Ichimoku cloud downwards. This will indicate a downtrend.
In order for the euro/dollar pair to resume its bullish run, the price needs to return to the Ichimoku cloud and the area above EMA 200, then rise above the important level of 1.1700 as well as break through the Tenkan line (red) and the 89-day exponential moving average (black), which converged near the level of 1.1735. In order for the pair to continue trading downwards, bears need to drag the price down from the Ichimoku cloud so that it could break through the technical psychological level of 1.1500. Here are the immediate targets of bulls and bears on the weekly chart. Now let's consider the technical situation on the daily chart.
Daily chart

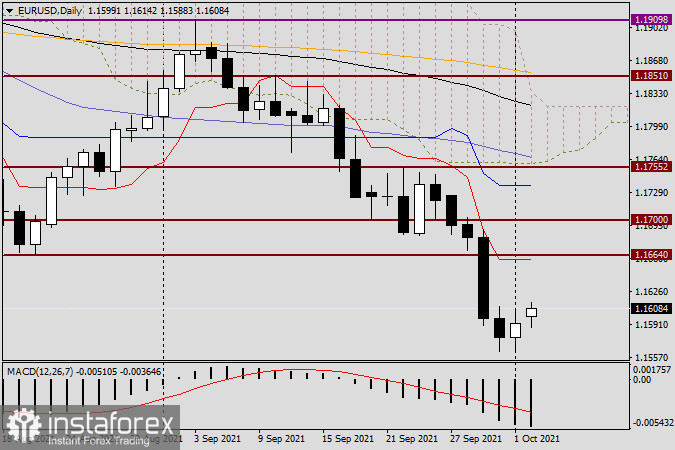
According to the daily chart, market sentiment is also bearish. True, the pair managed to correct a little on the last day of the last weekly trading. However, this apparently happened as traders locked in profits before the weekend. However, we cannot exclude a possible pullback to the broken resistance level of 1.1664, right below which the Tenkan line of the Ichimoku cloud indicator (red) is located. In this case, it will be possible to open short positions on the EUR/USD pair. At the moment, this trading idea seems to be the most profitable. Tomorrow, we will use other time frames to analyze the situation and, if necessary, make adjustments to this trading plan.
May your trading be lucrative!


