


To open long positions on GBP/USD, you need:
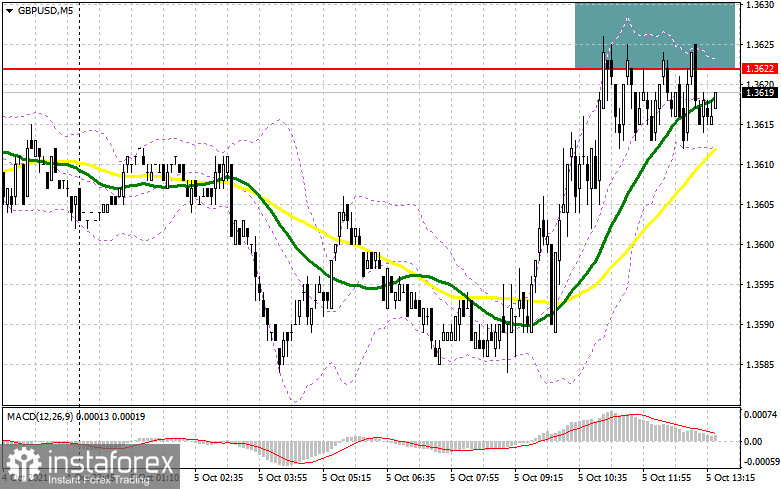
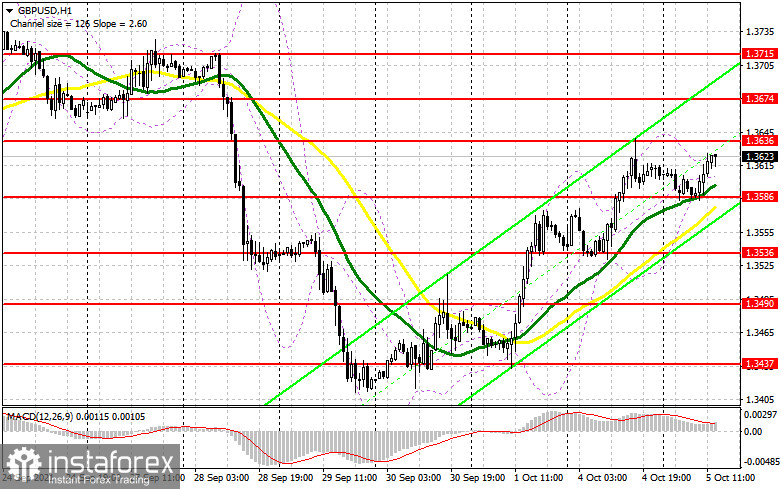
Weak fundamental data on the growth rates of the UK services sector in September this year did not allow buyers of the pound to get above the resistance of 1.3622. Let's look at the 5-minute chart and talk about what happened. An unsuccessful attempt to rise above 1.3622 and the formation of a false breakdown there in the first half of the day – all this formed a signal to open short positions on the pound, but it did not lead to a major sell-off within the day. When trading is conducted below this range, the pressure on the pound will remain, although the technical picture in the GBP/USD pair has partially changed. Only the strategy that I advise you to follow during the American session has not changed. The resistance of 1.3636, which was formed from 1.3622, is now holding the pound buyers from further upward correction. Only weak data on the American economy can lead to a new upward spurt of the pound. A breakout and a reverse test of 1.3636 from top to bottom form a buy signal for GBP/USD, which will push the pair even higher - to the area of 1.3674. A test of this area will be evidence of the continuation of the bullish trend formed last Thursday after a major drop in the pair, observed all week. The breakdown of this area will also open a direct road to the resistance of 1.3715, where I recommend taking the profits. If the pressure on GBP/USD returns in the afternoon and the short positions gained from the 1.3622 level is realized, I advise you not to rush into purchases. An important task for the bulls will be to protect the support of 1.3586, where the moving averages that play on the buyers' side are held. Only the formation of a false breakdown there forms a good entry point into long positions. Otherwise, the optimal scenario for buying will be a test of the next support of 1.3536, but even there, it is best to wait for the formation of a false breakdown. I advise you to look at long positions of GBP/USD immediately for a rebound only from the minimum of 1.3490, based on an upward correction of 25-30 points within a day.
To open short positions on GBP/USD, you need:
Bears were not very active even after weak statistics indicating a decline in the growth rate of the UK services sector for the second month in a row, which indicates that no people are willing to sell the pound even at current highs. The primary task of sellers is to regain control over the new support level of 1.3586, which coincides with the lower boundary of the upward correction channel formed on September 30. There are also moving averages that play on the buyers' side. A breakthrough of this area and its reverse test from the bottom up will form a signal to open short positions in the expectation of a decline in the pair to the level of 1.3536. A breakout of this range, which may occur in the afternoon during good data on the ISM index, will form another entry point into short positions to demolish stop orders of bulls and a larger fall to a minimum of 1.3490, where I recommend taking the profits. In case of further recovery of the pound and the absence of those willing to sell, only the formation of a false breakdown in the resistance area of 1.3636 will be a signal to sell GBP/USD. I advise you to immediately open short positions on the pound for a rebound from a larger resistance of 1.3674, or even higher - from a maximum of 1.3715, counting on the pair's rebound down by 20-25 points inside the day.
The COT reports (Commitment of Traders) for September 28 recorded both a sharp increase in short ones and an increase in those who bet on further growth of the pound. The British pound has been falling almost all week amid the fuel crisis that has flared up. Problems in supply chains led to disruptions in fuel supply to gas stations, and an acute shortage of drivers forced British Prime Minister Boris Johnson to involve the military in this. The corresponding reaction of buyers of risky assets followed immediately, and the pound collapsed against the US dollar. Strong data on the growth of the UK economy in the 2nd quarter of this year, which were revised upwards, did not help the pound much. However, the pressure on the pair decreased slightly, and traders recalled the statements of the Bank of England on monetary policy that decisions on its change could be made as early as November this year. The only problem that stands in the bulls' way remains the US Federal Reserve, which is also on the path of tightening monetary policy. I have repeatedly advised buying the pound with its significant corrections. So it happened last week. After a sharp decline, traders took advantage of the moment and bought it off at attractive prices. The COT report indicates that long non-commercial positions increased from 51,910 to the level of 57,923.
In contrast, short non-commercial positions jumped from the level of 52,128 to the level of 55,959, which led to a partial increase in the advantage of buyers over sellers. As a result, the non-commercial net position regained its positive value and grew from -218 to the level of 1964. The closing price of GBP/USD rose to 1.3700 against 1.3662 at the end of the week.
Signals of indicators:
Moving averages
Trading is conducted above 30 and 50 daily averages, which indicates the continuation of the bull market.
Note: The author considers the period and prices of moving averages on the hourly chart H1 and differ from the general definition of the classic daily moving averages on the daily chart D1.
Bollinger Bands
In case of a decline in the pound, the average border of the indicator around 1.3586 will provide support.
Description of indicators
- Moving average (moving average determines the current trend by smoothing out volatility and noise). Period 50. The graph is marked in yellow.
- Moving average (moving average determines the current trend by smoothing out volatility and noise). Period 30. The graph is marked in green.
- MACD indicator (Moving Average Convergence / Divergence - moving average convergence/divergence) Fast EMA period 12. Slow EMA period 26. SMA period 9
- Bollinger Bands (Bollinger Bands). Period 20
- Non-profit speculative traders, such as individual traders, hedge funds, and large institutions that use the futures market for speculative purposes and meet specific requirements.
- Long non-commercial positions represent the total long open position of non-commercial traders.
- Short non-commercial positions represent the total short open position of non-commercial traders.
- Total non-commercial net position is the difference between the short and long positions of non-commercial traders.


