The current week is becoming historic for bitcoin, because the coin managed to pass the entire range within which it fluctuated for two months. In a few days, the cryptocurrency overcame all the main resistance zones and passed the last difficult level of $53k. Now the coin has finally said goodbye to the bearish trend, going beyond the descending trend line. However, BTC reached the $55k mark and stopped growing, which may indicate both the probability of a downward reversal and a temporary pause. To determine the reason for the shutdown and further plans of the crypto asset, it is necessary to analyze the technical indicators of the cryptocurrency, which reflect the current situation of the coin and show the prerequisites for further price movement.
*Learn and analyze
Relative Strength Index (RSI) is a technical indicator that allows you to determine the strength of a trend (descending or ascending), warns of possible changes in the direction of price movement. Thanks to this metric, it is possible to determine at what stage an asset is overbought or underbought. The optimal mark for this chart is 60, if we are talking about a bullish trend. It indicates a high demand for the coin and the strength of the current upward momentum. When crossing this mark, the coin begins to move towards overbought.
MACD (Moving Average Convergence / Divergence Index) is an indicator that allows you to draw certain conclusions about the trend based on the movement of moving averages and finding metric values between them. The usual bullish signal is the intersection of the white line under the red, and bearish, on the contrary, when the white line from above crosses the red, which indicates a downward movement.
Stochastic (Stochastic Oscillator) - the indicator indicates the strength of the momentum of the current prevailing trend. If the indicator is above the 80 mark, then the asset can be considered overbought, if the stochastic is below 20, then this is an oversold asset signal.
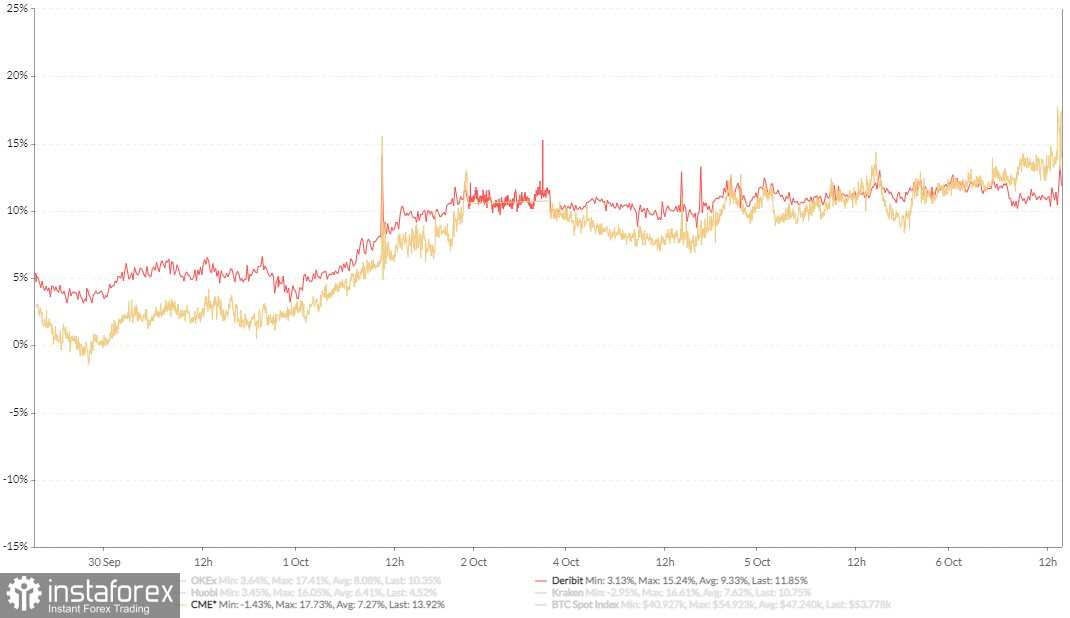
However, before you start the technical analysis of bitcoin, you need to be aware of the news agenda, and it's not just about global announcements. It is also important to track large movements of coins and fix local records of on-chain indicators. Among other things, an important announcement is the powerful upward dynamics of demand for bitcoin futures, which indicates the desire and intention of the market to continue the bullish trend. It may also become prerequisites for the approval of the first bitcoin futures fund in the United States, thanks to which the market will multiply in capitalization. Taking into account two interrelated factors, it can be argued that there are no fundamental changes in the current market sentiment. Then the question arises: why did bitcoin stop growing and get stuck near the $55k mark?
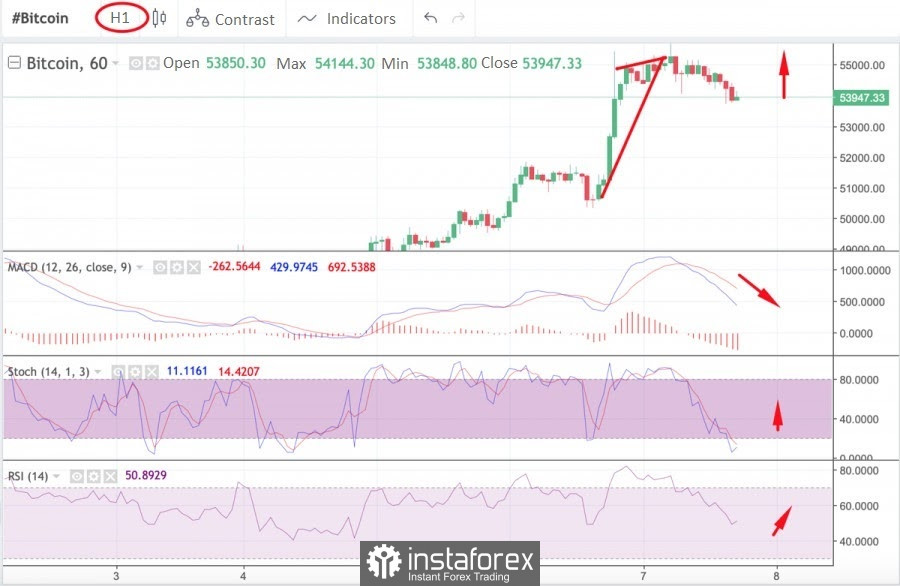
The hourly chart of the cryptocurrency shows the prerequisites for the recovery and continuation of the upward momentum of the price. However, a bullish divergence is forming according to the MACD indicator, as the indicator line goes down, and the price continues to rise. The stochastic oscillator is nearing the formation of a bullish intersection and the relative strength index supports its attempt to launch another impulse to buy. In addition, an ascending triangle figure has formed on the horizontal charts of BTC, but its bearish breakdown took place, which significantly strengthened the positions of sellers, who outweighed the volume of buyers. Most likely, the price will try to implement timid signals for growth, but everything indicates that this impulse will choke and the asset will begin to decline again.
*Learn and analyze
A bullish triangle is a figure on the horizontal charts of cryptocurrencies, indicating the continuation of price growth, with the successful overcoming of the horizontal resistance zone. In the case of a bearish breakdown of the lower border, a price decrease or trend reversal may occur.
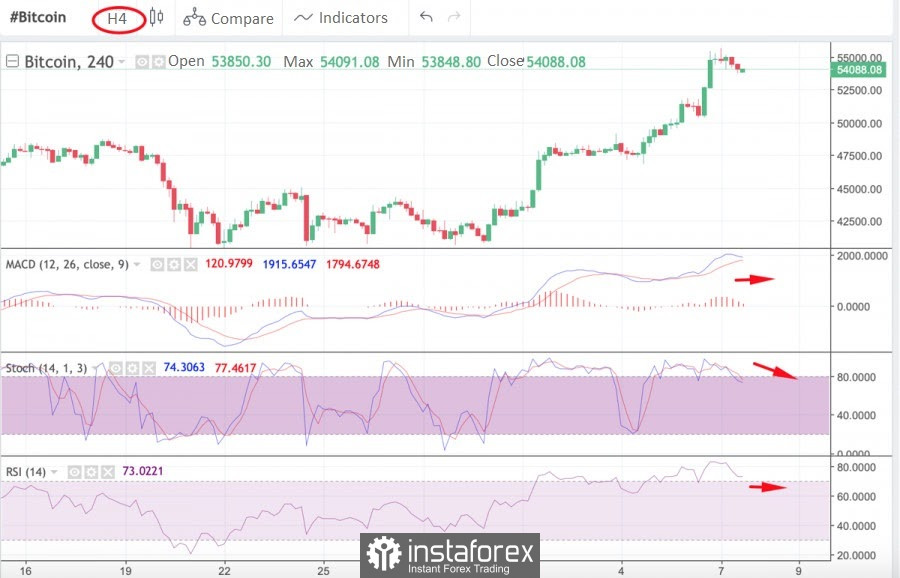
On the four-hour chart, BTC looks less confident, but the main indicators are starting to fall to safe positions, which may indicate a phase of price stabilization. This means that a support zone is being formed, which will become an important tool in holding the bullish trend. The MACD indicator is moving sideways, but it shows prerequisites for the formation of a bearish intersection, which indicates growing pressure on the price. The stochastic oscillator and the RSI index begin to recover near the 60 mark, moving sideways. It is likely that buyers are preparing to push the price up when trying to break $54k. However, to fully confirm this scenario, it is necessary to analyze the daily chart confirming the trend of narrower timeframes.
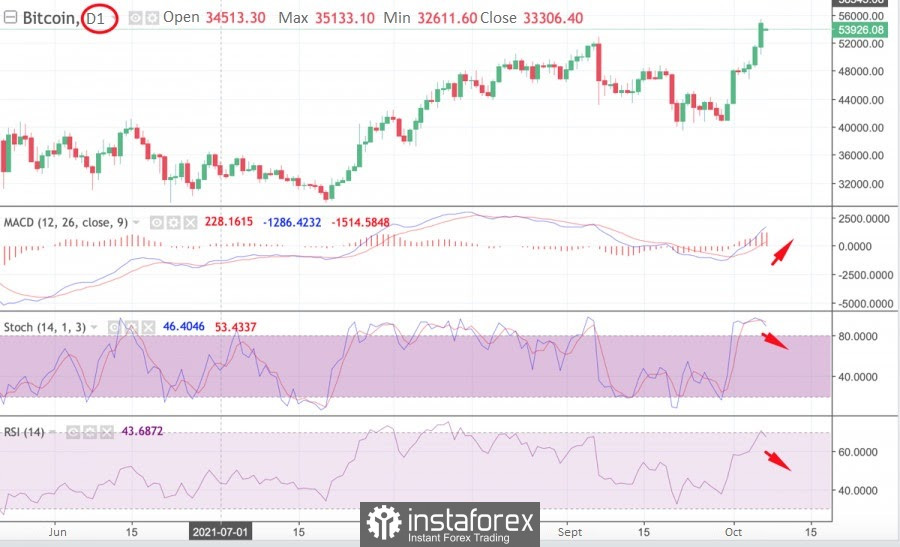
The daily chart of the cryptocurrency shows a trend towards a local correction, as the main indicators are in the overbought zone. The MACD indicator has left the red zone and continues to grow, while a divergence is forming for stochastic and RSI. The indicators are declining, but they are in the overbought zone, above the 60 mark. Technical analysis of different timeframes of bitcoin shows that the current bullish momentum has lost its main strength, which is why the indicators are starting to decline. This is due to the achievement of an important resistance zone and the completion of the current bullish momentum. In the near future, bitcoin indicators will stabilize, after a short accumulation phase, and the upward movement will resume. The main target of BTC is a successful consolidation above the $55k mark and further movement to $58k, where the final resistance zone in the range of $50k-$60k passes.