


Bitcoin
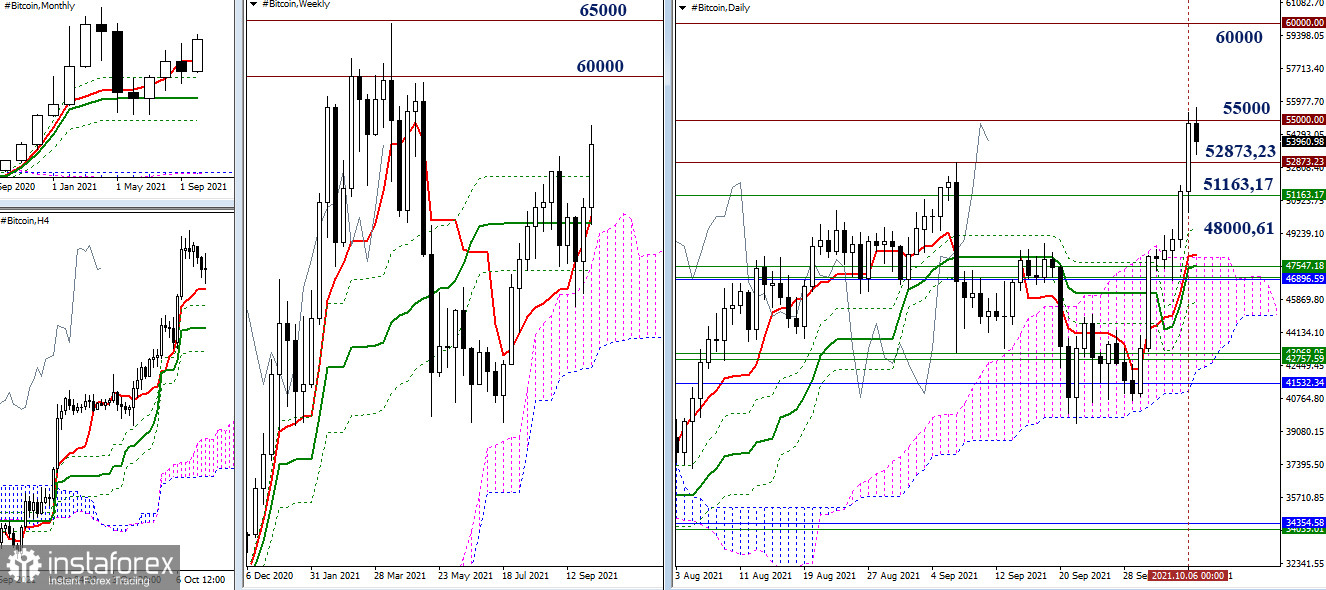
The bulls were busy completing the downward course and forming a rebound from the encountered support levels in the area of 41532.34 - 41028.86 (monthly Fibo Kijun + lower border of the daily cloud) during the past two weeks. The strategy has succeeded. At the moment, we were able to rise above all the closest resistance and attraction levels of this area. So, the daily cloud (48000.61), the final border of the weekly dead cross (51163.17), and the high of September (52873.23) were left behind. The upward movement continues.
A significant psychological level of 55000.00 is currently being tested. We observe a slight daily slowdown. In order to maintain opportunities and plan for the bulls, it is now important to maintain the reached positions. Even if there is no further progress yet, the achieved result also needs to be consolidated at the close of the week. The breakdown of the level of $ 55,000 opens the way to testing $ 60,000. After that, the most important thing is to break through the level of $ 65,000, which may not be implemented until April. The formation of a rebound from the encountered resistance of $ 55,000 will return Bitcoin to the overcame levels, which will now act as support levels of 52873.23 - 51163.17 - 48000.61.
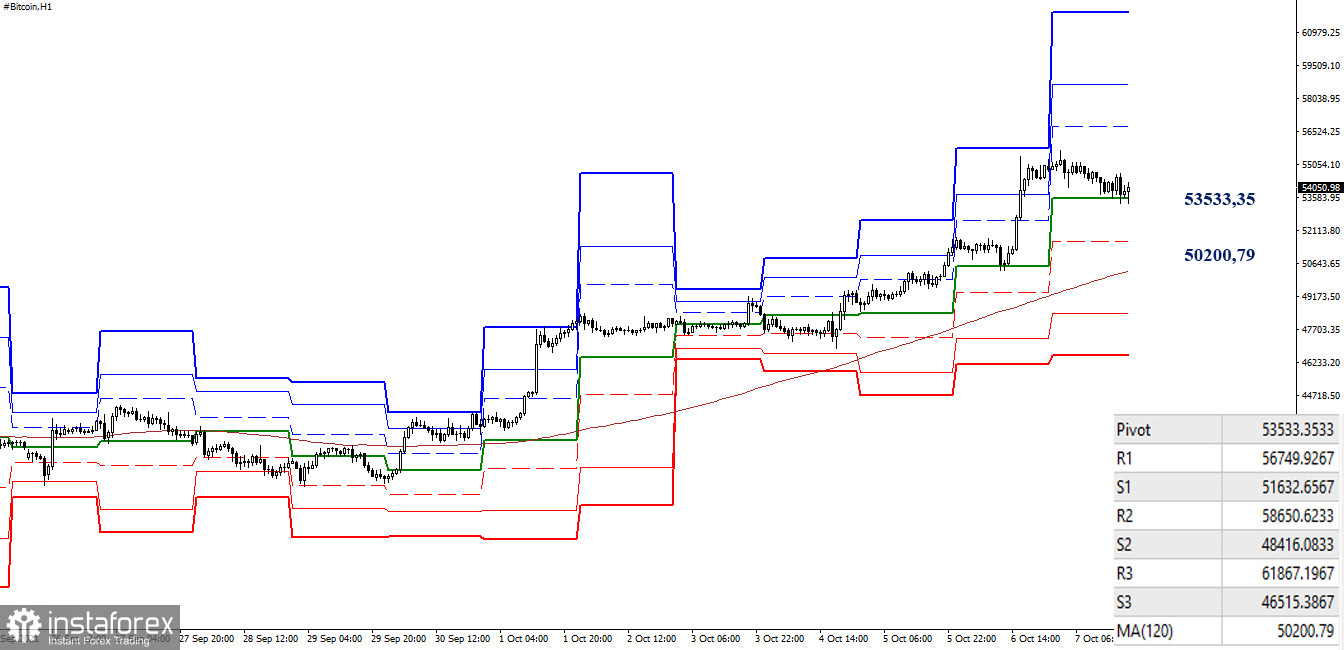
The advantage in the smaller timeframes is on the side of the bulls. The current decline has led the situation to the first significant support – the central pivot level of the day (53533.35). If a rebound occurs, the range of the pivot point of classic pivot levels is quite impressive 56749.93 - 58650.62 - 61867.20. The loss of the central pivot level will focus bearish interests on testing and conquering the next key level of the lower timeframes – the weekly long-term trend, which is now set at 50200.79.
***
Ichimoku Kinko Hyo (9.26.52) and Kijun-sen levels in the higher time frames, as well as classic Pivot Points and Moving Average (120) on the H1 chart, are used in the technical analysis of this cryptocurrency.


