


The British pound has weakened against the US dollar since the beginning of 2022. That's the British pound (GBP) has fallen over 20% against the US dollar (USD) since the start of the year, which is significant, especially since these are the two major currencies of the world.
The GBP/USD pair is at an all-time lowest against the dollar around the spot of 1.1651 - The GBP/USD pair is inside in downward channel. Since three weeks the GBP/USD pair decreased within an down channel, for that the GBP/USD pair hits new lowest 1.1498.
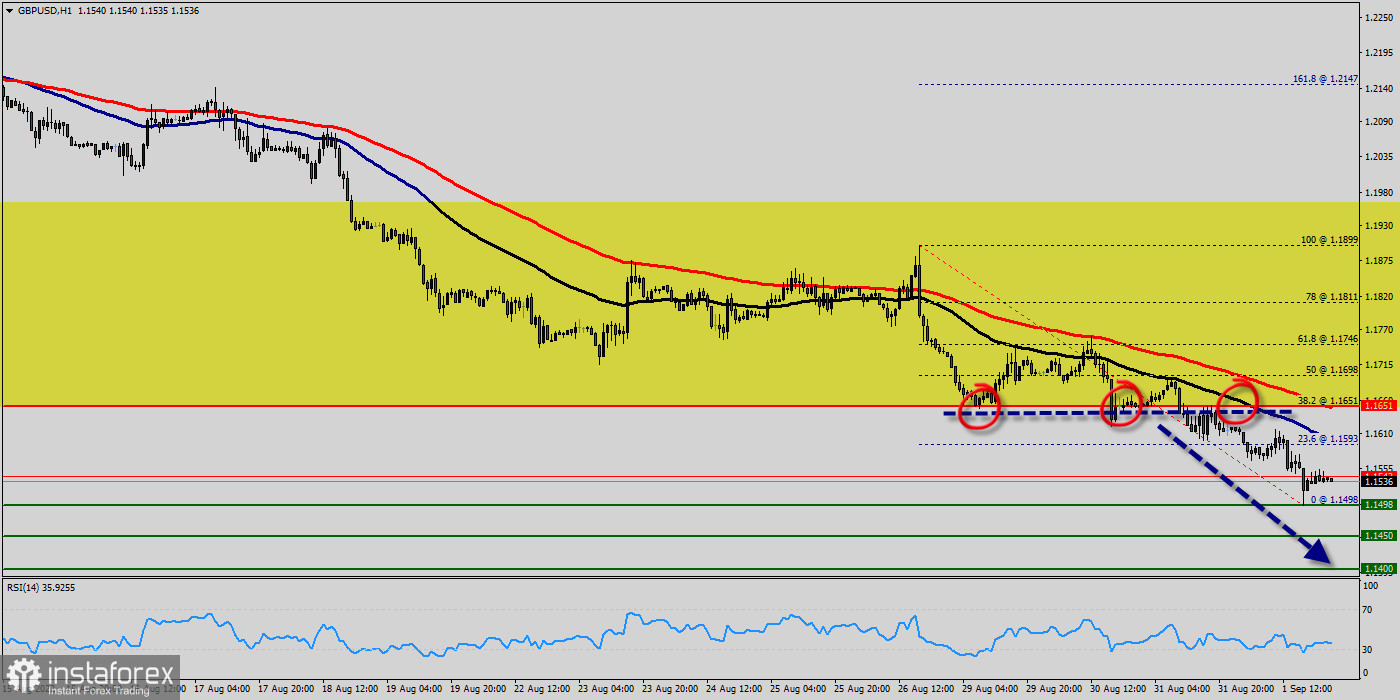
The drop has also concentrated in September. The GBP/USD pair continues to move downwards from the level of 1.1651. Yesterday, the pair dropped from the level of 1.1651 (this level of 1.1651 coincides with the ratio of 38.2%) to the bottom around 1.1498.
Today, the first resistance level is seen at 1.1651 followed by Yesterday (the weekly pivot point), while daily support 1 is found at 1.1498.
Also, the level of 1.1651 represents a weekly pivot point for that it is acting as major resistance/support this week. The GBP/USD pair fell with UK inflation elevated and still rising, the cost of living crisis taking hold, growth slowing and ongoing Brexit woes, the outlook for the pound is deteriorating.
Meanwhile, the USD is supported by safe-haven flows and hawkish Federal Reserve (Fed) bets. Amid the previous events, the pair is still in a downtrend, because the GBP/USD pair is trading in a bearish trend from the new resistance line of 1.1651 towards the first support level at 1.1498 in order to test it. If the pair succeeds to pass through the level of 1.1498, the market will indicate a bearish opportunity below the level of 1.1498.
The trend is still bearish as long as the price of 1.1651 is not broken. Thereupon, it would be wise to sell below the price of at 1.1498 with the primary target at 1.1450.
Then, the GBP/USD pair will continue towards the second target at 1.1400 (a new target is around 1.1400 ). Thus, the market is indicating a bearish opportunity below the above-mentioned support levels, for that the bearish outlook remains the same as long as the 100 EMA is headed to the downside.
However, traders should watch for any sign of a bullish rejection that occurs around 1.1651. The level of 1.1651 coincides with 38.2% of Fibonacci, which is expected to act as a major resistance today. Since the trend is below the 38.2% Fibonacci level, the market is still in a downtrend. Overall, we still prefer the bearish scenario.


