Analysis of previous deals:
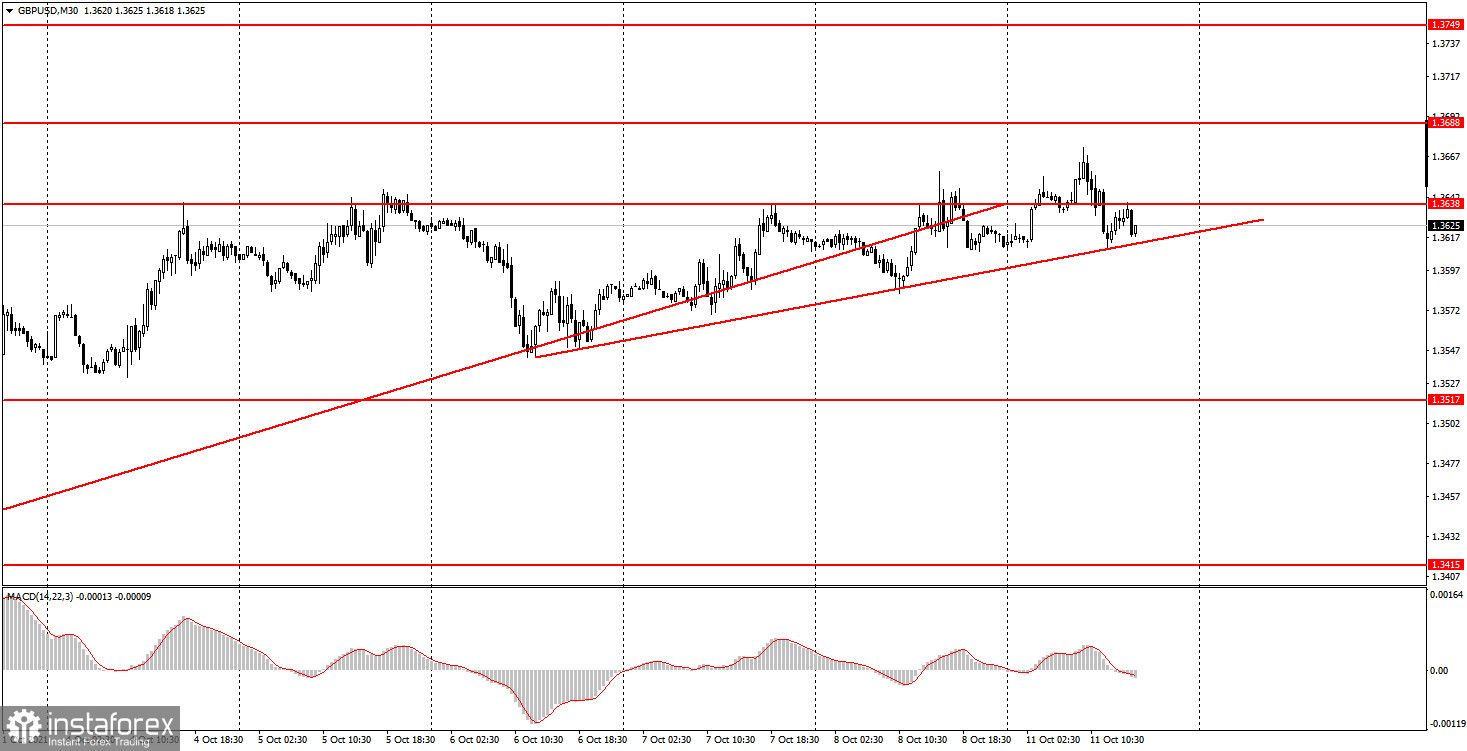
30M chart of the GBP/USD pair

The GBP/USD pair continues its weakened upward movement on the 30-minute timeframe. The price fell several times below the previous upward trend line, so it was canceled. Instead, a new upward trend line has been formed, which has a weaker slope and reflects the weakness of the current upward movement. Nevertheless, it remains relevant for now, but at the same time it can be canceled at any time. If the price settles below this line, then the chances of the pair going into a flat or into a new downward trend will increase many times. Thus, we still recommend using the 30-minute TF only for analysis and getting an idea of the overall technical picture. No important macroeconomic report or fundamental event in either the European Union or the United States on Monday. Thus, novice traders had nothing to react to during the day. Consequently, the pair's movements were not associated with the foundation. At the same time, the pound/dollar pair moved rather sluggishly (volatility was only 62 points), but did not stand still. Your best bet is to consider the lower TF.
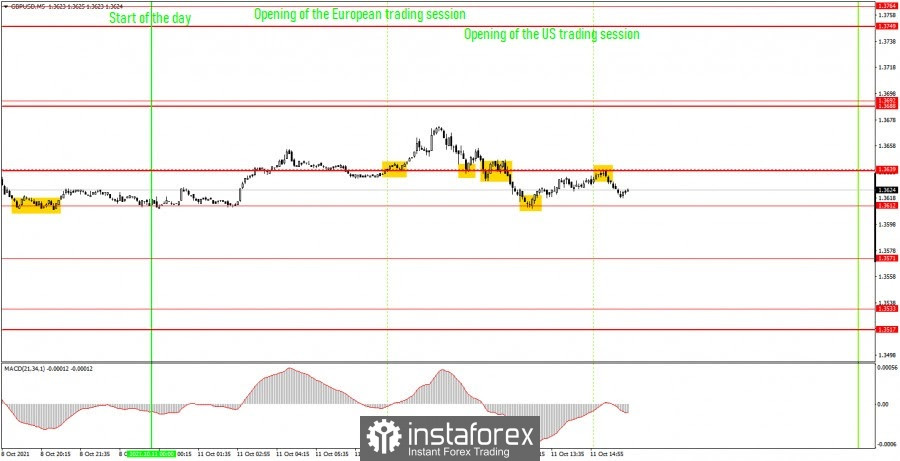
5M chart of the GBP/USD pair

Several trading signals were generated on the 5-minute timeframe on Monday. What is remarkable, despite all the ambiguity of the current movement, is that the signals were strong and clear enough. For example, after the first buy signal, the price went up 27 points, which is not so bad given the total volatility of 60. Unfortunately, novice traders failed to make money on this deal, it was closed by Stop Loss set at breakeven. The second buy signal turned out to be false, since the price went up after only 6 points had formed. The second long position was closed with a 15 points loss. All subsequent trading signals around the level of 1.3639 should not have been worked out, since at that moment two false signals had already been formed around it. But it was possible to work out the fourth buy signal in the form of a price rebound from the level of 1.3612. After it, the pair rose to the level of 1.3639 and bounced off it, so here it was necessary to take profit. It turned out to be small - about 10 points, but at least something. As we remember, we do not work out the last sell signal. As a result, today ended with minimal loss.
How to trade on Tuesday:
There is no clear trend at this time on the 30-minute timeframe. The upward movement seems to continue, and the bulls continued to stamp around the level of 1.3638. Thus, we still do not recommend considering signals from the MACD indicator. The current new uptrend line does not inspire much confidence yet. The important levels on the 5-minute timeframe are 1.3571, 1.3612, 1.3638, 1.3688. We recommend trading on them on Tuesday. The price can bounce off them or overcome them. As before, we set Take Profit at a distance of 40-50 points. At the 5M TF, you can use all the nearest levels as targets, but then you need to take profit, taking into account the strength of the movement. When passing 20 points in the right direction, we recommend setting Stop Loss to breakeven. There will be several macroeconomic reports in the UK on Tuesday, which at least theoretically can affect the pair's movement. Data on unemployment, the number of applications for unemployment benefits, as well as changes in average earnings will be published at the very beginning of the European session. The probability that this data will affect the course of trading in the pound/dollar pair is 50/50.
On the chart:
Support and Resistance Levels are the Levels that serve as targets when buying or selling the pair. You can place Take Profit near these levels.
Red lines are the channels or trend lines that display the current trend and show in which direction it is better to trade now.
The MACD indicator consists of a histogram and a signal line. When they cross, this is a signal to enter the market. It is recommended to use this indicator in combination with trend lines (channels and trend lines).
Important speeches and reports (always contained in the news calendar) can greatly influence the movement of a currency pair. Therefore, during their exit, it is recommended to trade as carefully as possible or exit the market in order to avoid a sharp price reversal against the previous movement.
Beginners on Forex should remember that not every single trade has to be profitable. The development of a clear strategy and money management are the key to success in trading over a long period of time.


