


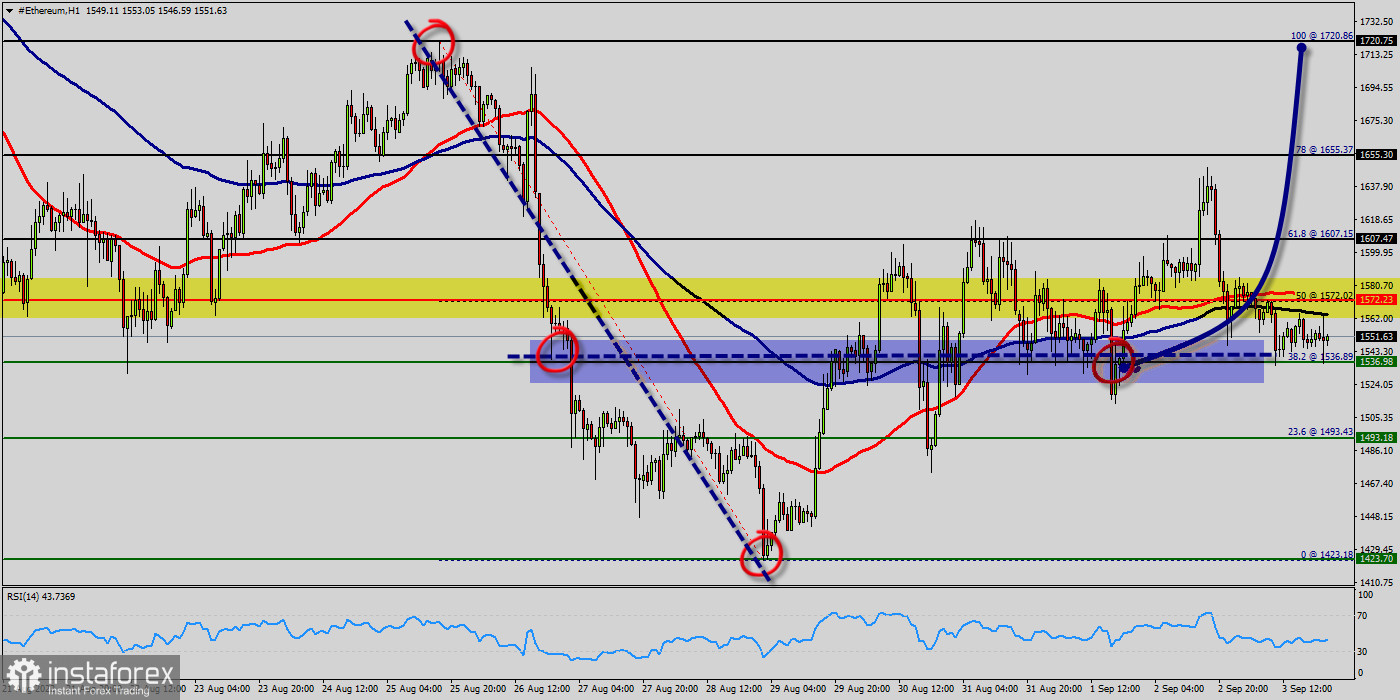
Ethereum : The bullish trend is currently very strong for Ethereum - ETH/USD. As long as the price remains above the support at 1,536 USD, you could try to take advantage of the bullish rally in short term.
The first bullish objective is located at 1,607 USD (this price is coincided with the ratio 61.8% of Fibonacci retracement levels). The bullish momentum would be revived by a break in this resistance.
Since three weeks ETH/USD increased within an up channel, for that Ethereum hits new highs $ 1,536 and $ 1,500.
Ethereum price had a significant breakout above the price of$ 1,536 and $ 1,500. ETH/USD is part of a very strong bullish trend. Traders may consider trading only long positions as long as the price remains well above the levels of $ 1,536 and $ 1,500.
Currently, the price is in a bullish channel. This is confirmed by the RSI indicator signaling that we are still in a bullish trending market. As the price is still above the moving average (100), immediate support is seen at $ 1,536, which coincides with a golden ratio (38.2% of Fibonacci).
Consequently, the first support is set at the level of $ 1,536. Hence, the market is likely to show signs of a bullish trend around the spot of$ 1,536 and $ 1,500.
The next resistance located at $ 1,572 is the next bullish target to be reached. A bullish break in this resistance would boost the bullish momentum. The bullish movement could then continue towards the next resistance located at $ 1,607.
Closing above the pivot point (20,699 USD) could assure that BTC/USD will move higher towards cooling new highs. The bulls must break through 1,536 USD in order to resume the up trend.
Buyers would then use the next resistance located at 1,720 USD as an objective (this price is coincided with the ratio 100% of Fibonacci retracement levels - the double top - te last bullish wave on the hourly chart). Ethereum price is bullish but climbing higher will be strict, our next target $ 1,800.
Crossing it would then enable buyers to target $ 1,800. Be careful, given the powerful bullish rally underway, excesses could lead to a short-term rebound.
Also it should be noted that Ethereum and cryptocurrencies unite as the bears lose their momentum. The market is indicating a bullish opportunity above the above-mentioned support levels, for that the bullish outlook remains the same as long as the 100 EMA is headed to the upside.
Ethereum 's price has been consolidating between the 1,500 USD and 1,800 USD over the last few weeks, following a massive rising from the 1,500USD mark. So far, the price has been supported by the $ 1,500 and $ 1,600 range.
Trading recommendations:
Buy orders are recommended above the golden ratio ($ 1,536) with the first target at the level of $ 1,607. Furthermore, if the trend is able to breakout through the first resistance level of $ 1,655. We should see the pair climbing towards the double top ( $ 1,720) to test it. The pair will move upwards continuing the development of the bullish trend to the level $1,720. It might be noted that the level of $1,800 is a good place to take profit because it will form a new double top in coming hours.


