


Wave pattern
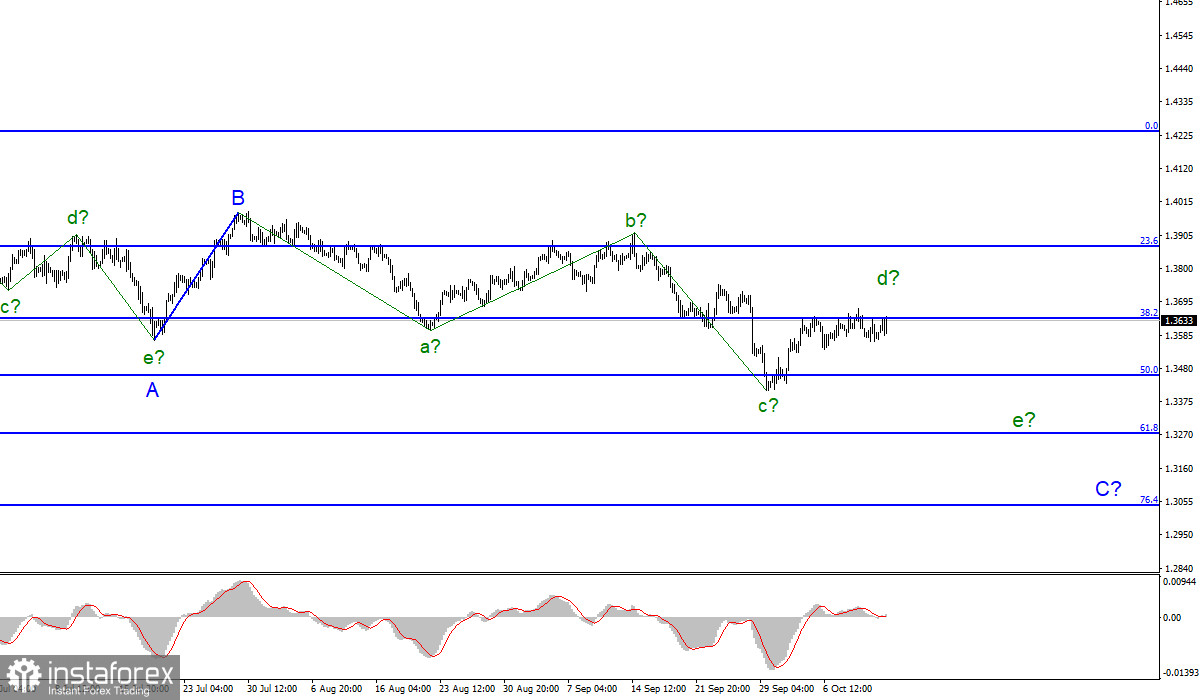
For the pound/dollar, the wave marking has become more complicated. Now, a downward trend section is likely to be built. The instrument made a successful attempt to break through the low of the previous waves a and e. Thus, adjustments were made to the wave pattern. Now, it has acquired the form of a downward trend section with prospects of a correction. The internal structure of the proposed wave A also signals such a scenario. Apart from that, this wave is not impulsive. From this section of the trend, wave c also took a non-impulsive form. At the moment, only three waves are clearly visible in it. However, within the correction structures, wave markings can be both three-wave and five-wave and take a very complex form. So, given the unsuccessful attempt to break through the 38.2% Fibonacci level, the construction of a new descending wave may occur, possibly e, consisting of c in C. A successful attempt to break through the 38.2% level may lead to the construction of a three-wave ascending section. Over the past few days, there have been no reasons to make adjustments to the current wave layout.
No matter good statistics or negative, the pair is unlikely to break through 1.3643.
The pound/dollar has been moving with an amplitude of about 35 pips on Wednesday. The same movement was seen the day before and on Monday. The pair is trading steadily. Yet, it is trading mainly below the 1.3643 level. Several attempts to break through this level have been fruitless. Thus, it is hard to say that the ascending wave (presumably d in C) has completed its construction, but it is also unlikely that it continues its construction. Today, the macroeconomic calendar contains some important reports for the pound/dollar pair even in comparison with the euro/dollar pair.
In the morning, the UK unveiled the GDP and industrial production reports. Additionally, the UK revealed its balance of trade and constructional output data. However, the first two reports are more crucial. They turned out to be rather controversial. GDP was worse than market expectations and amounted to 0.4% MoM and to 2.9% YoY. Industrial production data was better than expected. The indicator totaled 0.8% MoM and 3.7% YoY. The GDP indicator was not quarterly. This is why it is not so significant. In general, market participants did not react to these reports. US inflation data caused more havoc to the movements of the pair.
Conclusion
The wave pattern has changed dramatically in recent weeks. It shows a downward construction with non-impulsive waves. Therefore, it is recommended to sell the pair for each MACD signal based on the construction of wave C. It may be quite long with targets located near 1.3273, which corresponds to 61.8% Fibonacci. An unsuccessful attempt to break through the 1.3643 level indicates that traders are refraining from opening long positions on the pound sterling. Now, the construction of a new downward wave may begin.
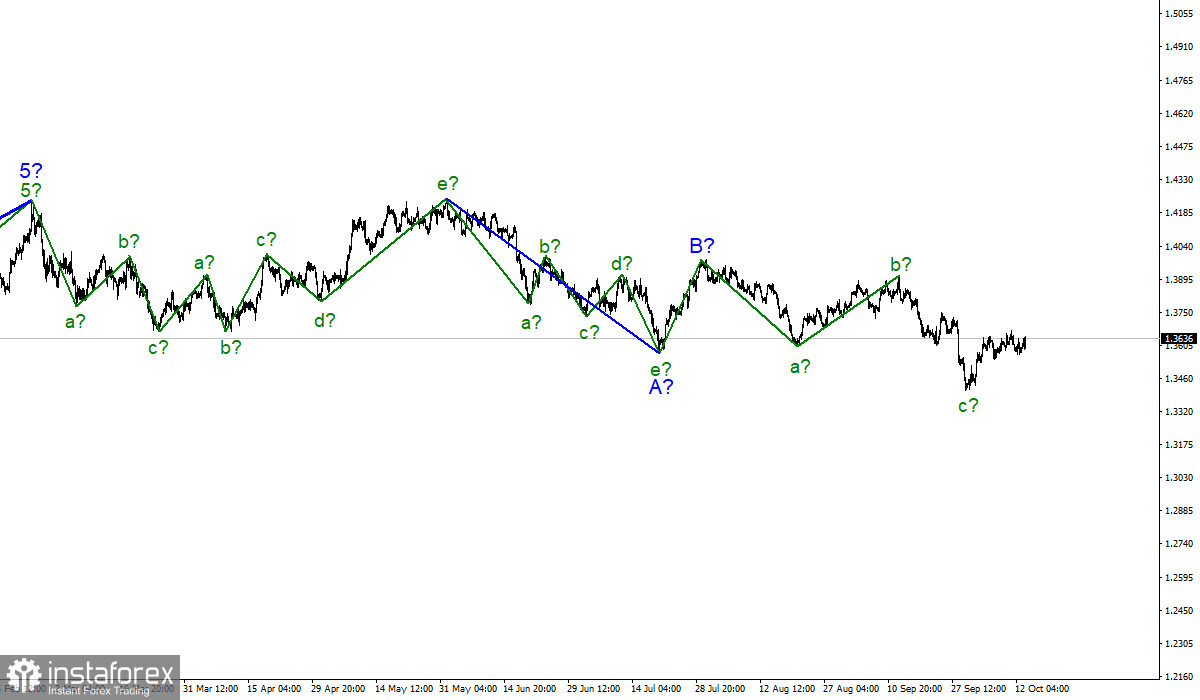
Larger timeframe
The upward section of the trend, which began its construction a couple of months ago, has taken a rather ambiguous form and has already been completed. The construction of the upward trend section has been canceled. Now, analysts assume that on January 6, the construction of a new downward trend section began, which can turn out to be almost any length.


