EUR/USD

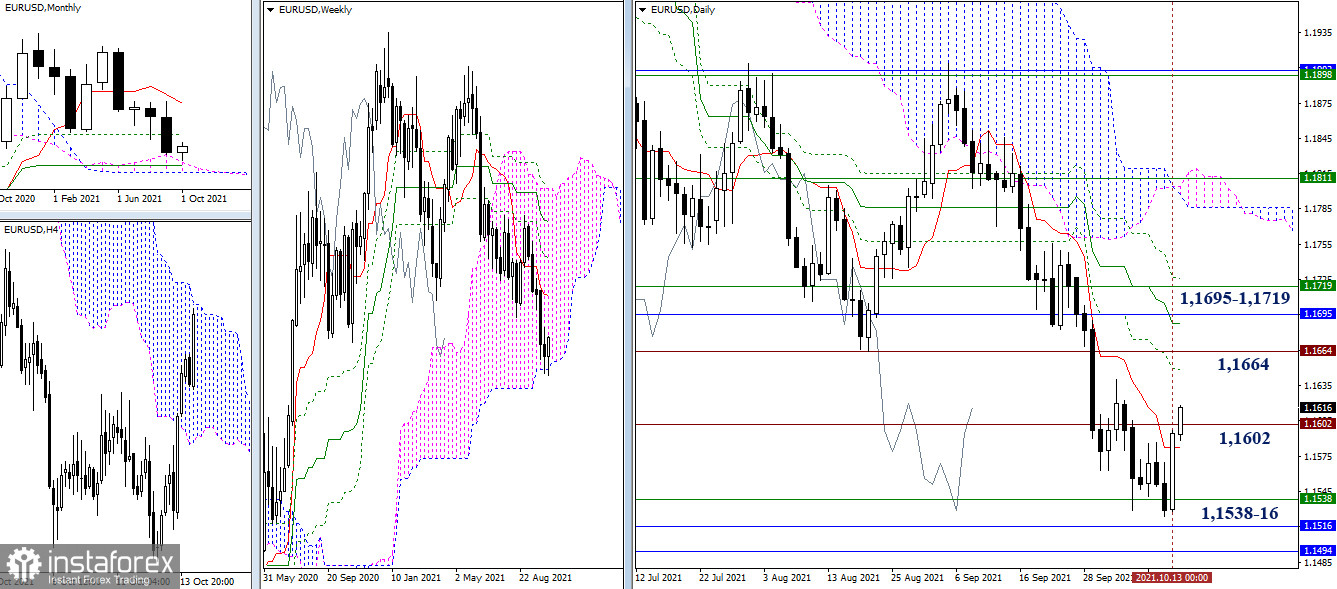
The bulls decided to attack while feeling the bears' uncertainty to test and break through the support levels of 1.1538 - 1.1516 - 1.1494. As a result, they managed to restore their positions yesterday to the first resistance area of 1.1582 - 1.1602 (daily short-term trend + historical level). Today, bullish traders are trying to break through the met resistance and continue growth. The next pivot points are located at 1.1649-64 (daily Fibo Kijun + historical level). An even more powerful resistance zone of 1.1695 - 1.1719 (monthly Fibo Kijun + weekly Tenkan + final levels of the daily Ichimoku cross) can be noted slightly above.

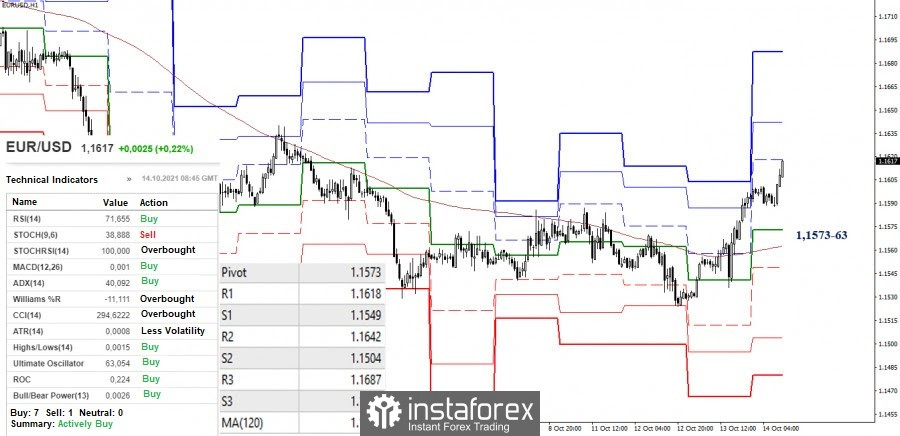
The advantage in the smaller timeframes had previously shifted to the bullish side. They captured key levels, reversed the weekly long-term trend, and continued to rise. At the moment, the first resistance of the classic pivot levels (1.1618) is being tested. The next pivot points are located at 1.1642 (R2) and 1.1687 (R3). The key levels in the same timeframe are protecting the interests of the bulls at the borders of 1.1573 (central pivot level) - 1.1563 (weekly long-term trend).
GBP/USD

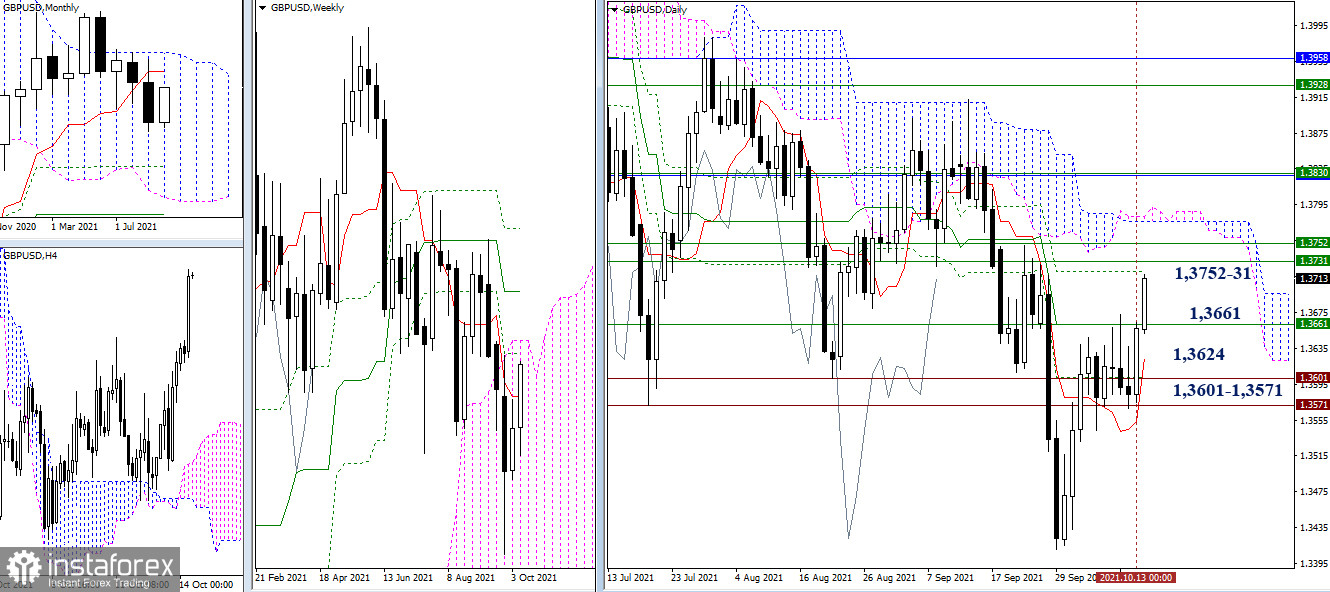
The bulls took the lead yesterday, but they failed to leave the consolidation zone. Today, they are trying to exit the zone, breaking its upper limit of 1.3661 (weekly short-term trend). The nearest resistances on the way are currently located in the area of 1.3731-52 (upper border of the weekly cloud + weekly Fibo Kijun). Its breakdown will determine future prospects.

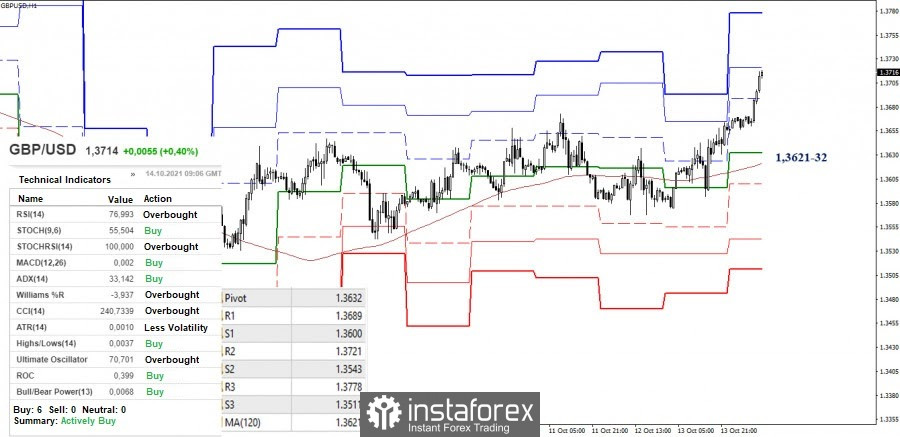
After the bulls seized the advantage, they managed to push off from the key levels and further increase. Therefore, we are now witnessing the development of an upward trend. They have already reached the second resistance from the classic pivot levels (1.3721), so the next resistance of 1.3778 (R3) will serve as the intraday pivot point. The key levels hold the defense today, joining forces in the area of 1.3621-32 (central pivot level + weekly long-term trend).
***
Ichimoku Kinko Hyo (9.26.52) and Kijun-sen levels in the higher time frames, as well as classic Pivot Points and Moving Average (120) on the H1 chart, are used in the technical analysis of the trading instruments.


