To open long positions on GBP/USD, you need:
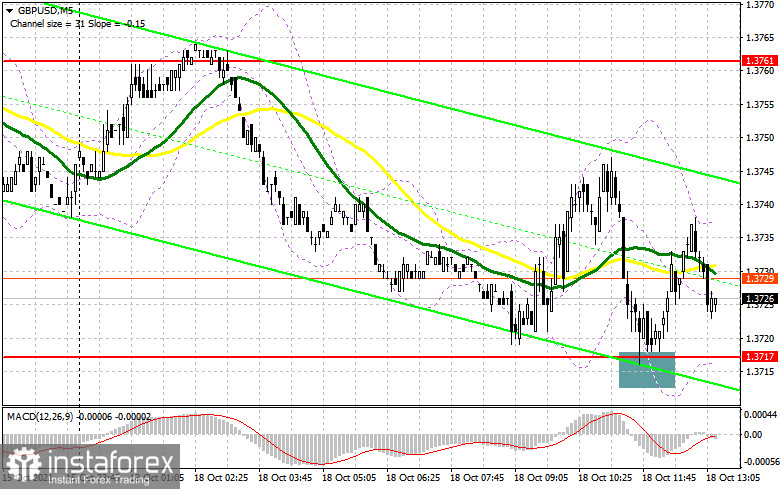
In the first half of the day, I paid attention to the 1.3717 level and advised them to enter the market. Let's look at the 5-minute chart and talk about where and how to act. It is visible how we did not reach the level of 1.3717 on the first attempt. Accordingly, no input signals were formed. And only by the middle of the European session, the formation of a false breakdown in the area of 1.3717 led to the entry point for the opening of long positions. At the time of writing, the upward movement was about 18 points, and the signal continued to work itself out. The fact that the bulls managed to protect this range indicates the likelihood of continued growth of the pound in the short term, although nothing has changed from a technical point of view.
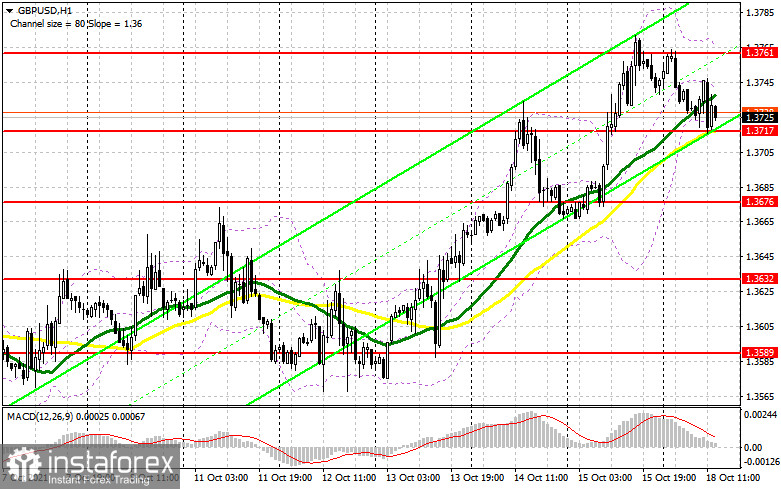
In the afternoon, we are waiting for the speech of the Deputy Governor of the Bank of England for Financial Stability, Jon Cunliffe. He may shake the market a little, which will lead to a surge in the pair's volatility and go beyond the side channel. Also, we should not forget about the fundamental statistics on the American economy, which can positively impact buyers of the US dollar. But the buyers of the pound need to continue to do everything to protect the support of 1.3717, in the area of which the moving averages are playing on their side. As long as trading is conducted above this range, we can count on the continued growth of the pair. Another false breakout formation during the American session forms an entry point into long positions to recover to a weekly maximum in the area of 1.3761. A breakthrough and consolidation above this range with a reverse test from top to bottom will allow the British pound to get to new local levels: 1.3803 and 1.3839, where I recommend fixing the profits. The 1.3878 area remains a longer-range target. In case of a repeated decline of the pair and the absence of active actions on the part of the bulls in the area of 1.3717, the optimal scenario for buying will be a test of the following support: 1.3676. I advise you to look at long positions of GBP/USD immediately for a rebound only from the minimum of 1.3632, counting on an upward correction of 25-30 points within a day.

To open short positions on GBP/USD, you need:
Sellers of the pound are not particularly trying to enter the market yet, even at such high prices, which casts doubt on the further development of the downward correction of the pair, which everyone is waiting for. Most likely, the entire focus of sellers in the afternoon will be more on the protection of 1.3761 to prevent the weekly maximum from being updated, which will seriously affect the mood of buyers of the pound. Only an unsuccessful attempt to consolidate above this range and the formation of a false breakdown there form a signal to open short positions in the expectation of a decline in the pair. An equally important task for sellers will still be a breakthrough and the return of control over the support level of 1.3717, which could not be done in the first half of the day. A breakdown of this area and its reverse test from the bottom up will form a signal to open short positions based on the test of 1.3676 and then update the minimum in the area of 1.3632, where I recommend fixing the profits. In case of further recovery of the pound and the absence of those willing to sell at 1.3761, only the formation of a false breakdown in the area of the next resistance at 1.3803 will be a signal to open short positions in GBP/USD. I advise selling the pound immediately for a rebound from the larger resistance of 1.3839, counting the pair's rebound down by 20-25 points within the day.

The COT reports (Commitment of Traders) for October 5 recorded a sharp increase in short positions and a reduction in long positions, which led to a move to the negative zone of the total net position. Despite a fairly active recovery of the pair a week earlier, it was not possible to continue the bullish trend for the pound. However, there were all the prerequisites for this. As the data showed, problems in the supply chains in the UK remain at a fairly high level, which causes prices to creep up. It is unlikely that such a development of the situation will force the Bank of England to stand aside for a long time and watch the inflationary spiral unfold. The minutes of the meeting of the British regulator, which was published a week earlier, indicated that changes in monetary policy could be adopted as early as November this year. Therefore, the only problem that stands in the way of buyers of the pound is the US Federal Reserve, which is also heading for tightening monetary policy. Despite all this, I advise buying the pound with its significant corrections, as the growth of the trading instrument is expected in the medium term. The COT report indicates that long non-commercial positions decreased from the level of 57,923 to 48,137.
In contrast, short non-commercial positions jumped from the level of 55,959 to the level of 68,155, which led to a partial increase in the advantage of sellers over buyers. As a result, the non-commercial net position returned to the negative zone and dropped from the 1964 level to the -20018 level. The closing price of GBP/USD dropped 1.3606 against 1.3700 at the end of the week.
Signals of indicators:
Moving averages
Trading is conducted above 30 and 50 daily moving averages, which indicates the continuation of the pound's growth in the short term.
Note: The author considers the period and prices of moving averages on the hourly chart H1 and differ from the general definition of the classic daily moving averages on the daily chart D1.
Bollinger Bands
A break of the lower limit of the indicator in the area of 1.3717 will increase the pressure on the pair. Growth will be limited around the upper level of 1.3761.
Description of indicators
- Moving average (moving average determines the current trend by smoothing out volatility and noise). Period 50. The graph is marked in yellow.
- Moving average (moving average determines the current trend by smoothing out volatility and noise). Period 30. The graph is marked in green.
- MACD indicator (Moving Average Convergence / Divergence - moving average convergence/divergence) Fast EMA period 12. Slow EMA period 26. SMA period 9
- Bollinger Bands (Bollinger Bands). Period 20
- Non-profit speculative traders, such as individual traders, hedge funds, and large institutions that use the futures market for speculative purposes and meet specific requirements.
- Long non-commercial positions represent the total long open position of non-commercial traders.
- Short non-commercial positions represent the total short open position of non-commercial traders.
- Total non-commercial net position is the difference between the short and long positions of non-commercial traders.


