


EUR/USD 5M
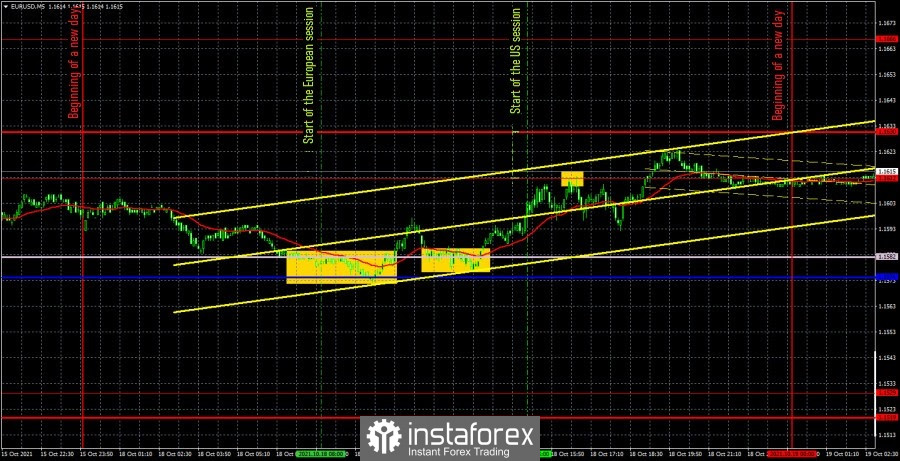
The EUR/USD pair showed "mind-blowing" movements during the first trading day of the new week. However, we warned about this in the last review. The release of only one absolutely passable macroeconomic report was scheduled for Monday, so it is not at all surprising that the pair passed its standard 40 points and that was it. Industrial production in the United States in September fell by 1.3% m/m instead of growth by 0.3%, as predicted by experts. However, there was no serious fall in the dollar. Quite the opposite. Since the publication of this report, the US currency has strengthened slightly. Therefore, once again we have to say that the markets simply ignored the statistics. The movements were varied on the 5-minute timeframe today. And it was very difficult to work them out, since the nature of the movements was constantly changing. Two buy signals were generated during the European trading session. Senkou Span B and Kijun-sen lines were located close to each other, so they should be considered as a support area. The price bounced from this support area twice. Therefore, traders had reason to buy the euro in the first half of the day. Oddly enough, both signals, which were formed for several hours each, turned out to be strong in the end, since the pair managed to get to the closest extremum level of 1.1612 and reach it. Although, most likely, this happened due to the fact that this level was located very close to the Ichimoku lines. One way or another, but the goal was achieved, therefore, a profit of about 16 points should be fixed near it. It was already necessary to open short positions on a signal to sell about a rebound from the level of 1.1612, which should have been closed manually in the profit of several points in the late afternoon. Thus, it was possible to earn about 20 points yesterday, which is not bad at all with a total volatility of 40.
EUR/USD 1H
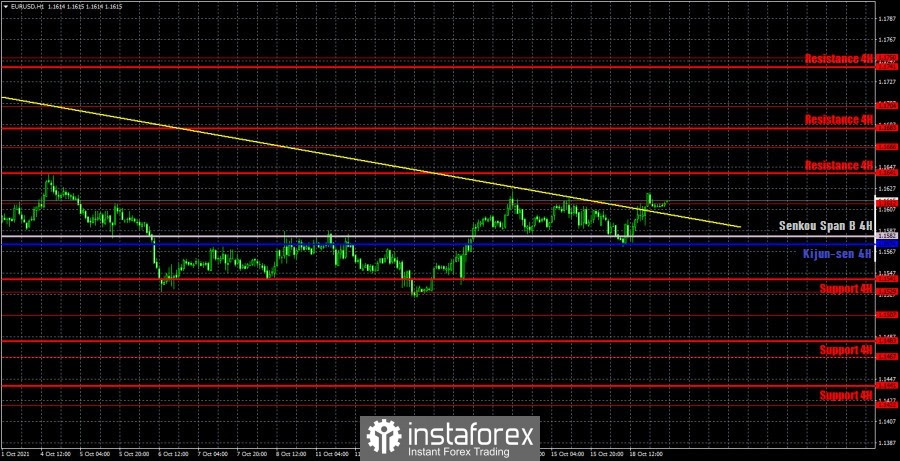
You can see that the euro/dollar pair has once again worked out the descending trend line on the hourly timeframe, and will now try to settle above it once again. Thus, the downward trend is now on the verge of being canceled. If the bulls manage to overcome the trend line, then the upward movement will continue, but it is unlikely to be strong, since the pair has been moving with an average volatility of 40-50 points for more than three months. Moreover, as a rule, volatility does not exceed 40 points in four out of five cases, and on the fifth day the pair passes 60-70 points, which provides an average volatility of about 50. On Tuesday we highlight the following levels for trading - 1.1507, 1 , 1529, 1.1612 and 1.1666, as well as the Senkou Span B (1.1582) and Kijun-sen (1.1574) lines. The Ichimoku indicator lines can change their position during the day, which should be taken into account when looking for trading signals. Signals can be rebounds or breakthroughs of these levels and lines. Do not forget about placing a Stop Loss order at breakeven if the price moves 15 points in the right direction. This will protect you against possible losses if the signal turns out to be false. No major fundamental or macroeconomic event planned in the European Union or the United States on October 19. Thus, it is hardly worth expecting an increase in movements today. Most likely, the nature of trading will remain the same as it was before.
We recommend you to familiarize yourself:
Overview of the EUR/USD pair. October 19th. The euro is still standing still, but the markets are tired of the "Fed factor".
Review of the GBP/USD pair. October 19th. British paradox: falling unemployment with a persisting labor shortage.
Forecast and trading signals for GBP/USD for October 19. Detailed analysis of the movement of the pair and trade deals.
Analysis of the COT report
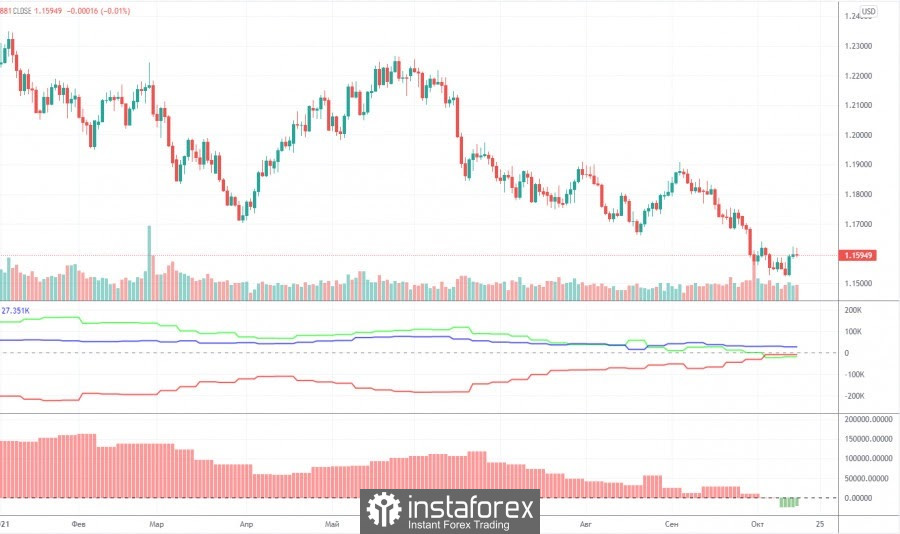
The mood of non-commercial traders practically did not change during the last reporting week (October 5-11). It even became a little less bearish. But all the same, it is already bearish, since for the first time in a long time the total number of open short positions for the "non-commercial" group exceeds the total number of open buy contracts (222,000 versus 203,000). During the reporting week, professional traders opened 5,700 buy contracts (longs) and 2,400 sell contracts (shorts). Thus, the net position increased by 3,300 contracts, but such a change is considered negligible for the general picture of things. We draw attention to another fact. At the beginning of this year, the net position of big players exceeded 150,000, and since then the European currency has fallen in price by only 6 cents, and the net position has lost about 170,000 contracts. We believe that the European currency has depreciated too weakly, given the changes in the data on contracts from professional players. We also draw attention to the fact that the euro is falling very weakly. As we have calculated more than once, by about 15 points a day. Every day, but the volatility still remains very weak. The weak volatility makes you doubt everything that is happening now with the pair. The US dollar still does not look like a currency that may show a strong trend in the near future. But, nevertheless, it continues to grow for more than a month. As a result, the Commitment of Traders (COT) reports now show a very likely continuation of the euro's decline. But we also recommend correlating these findings with the current technical picture.
Explanations for the chart:
Support and Resistance Levels are the levels that serve as targets when buying or selling the pair. You can place Take Profit near these levels.
Kijun-sen and Senkou Span B lines are lines of the Ichimoku indicator transferred to the hourly timeframe from the 4-hour one.
Support and resistance areas are areas from which the price has repeatedly rebounded off.
Yellow lines are trend lines, trend channels and any other technical patterns.
Indicator 1 on the COT charts is the size of the net position of each category of traders.
Indicator 2 on the COT charts is the size of the net position for the non-commercial group.


