As anticipated in yesterday's review of the main Forex currency pair, the main scenario was seen as upwards. In fact, that's exactly what happened. As far as today's events, no significant reports from the Eurozone are scheduled in the economic calendar. Data on the number of building permits and new house starts will be published. Later in the evening, US Federal Open Market Committee (FOMC) members Mary Daly, Michelle W. Bowman, and Raphael Bostic will make their speeches. That's probably all of today's events.
Daily
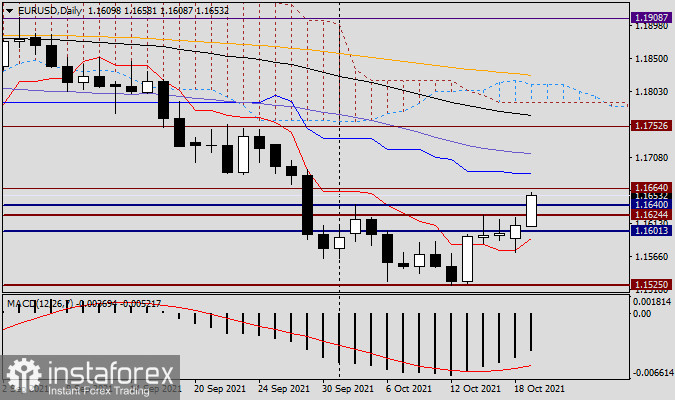
Yesterday's recommendations to try to buy on a pullback to 1.1600 or to the red Tenkan line of the Ichimoku indicator proved correct. As expected, after the price consolidated above the Tenkan for three consecutive daily candles, this line gave the pair good support. It was after the decline towards the Tenkan that the quote reversed and started to rise. As a result, Monday's highs were shown at 1.1623 and the closing price was 1.1610. Considering the significance of the 1.1600 level, this is not a bad result for the euro bulls. It is also worth noting how clearly the resistance level of 1.1624, which threw the pair back down, performed its function. The EUR/USD showed a steady and quite strong growth today. Now the pair is already trading near 1.1655, breaking the sellers' resistance at 1.1640, where the highs of October 4 were shown. If the rally continues, the broken support at 1.1664 and the blue Kijun line of the Ichimoku indicator will be the nearest targets. The whole question is whether the bulls will continue their rate hike?
H4
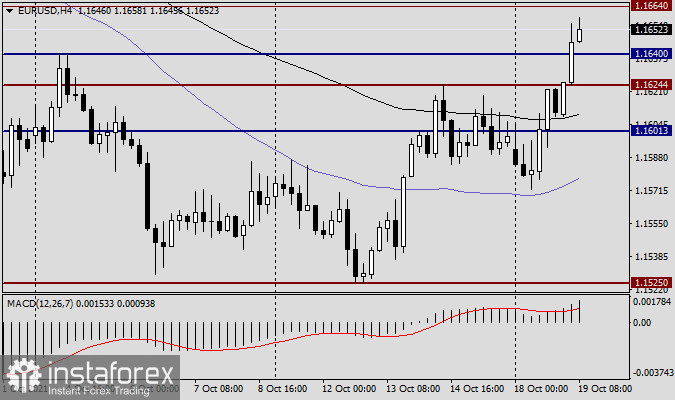
Looking at the 4-hour chart, the options to open positions are 1.1664 and the 200 exponential moving average, which is coloured orange on the chart. If the level and the 200 EMA are broken through, wait for it to settle, and then try to buy on a pullback. If a bearish reversal candlestick or a combination of candlesticks below 1.1664 and the 200 exponent appears, this will be a signal to open a sell. The closest targets for long positions are near the landmark level of 1.1700. The closest benchmark for fixing profit on sales is the 1.1625-1.1600 range. It is likely that today's situation and its closing price will further clarify the EUR/USD picture. At the moment, according to the author's personal opinion, purchases remain the highest priority. The already quite impressive growth that is taking place at the moment is a little alarming.


