EUR/USD

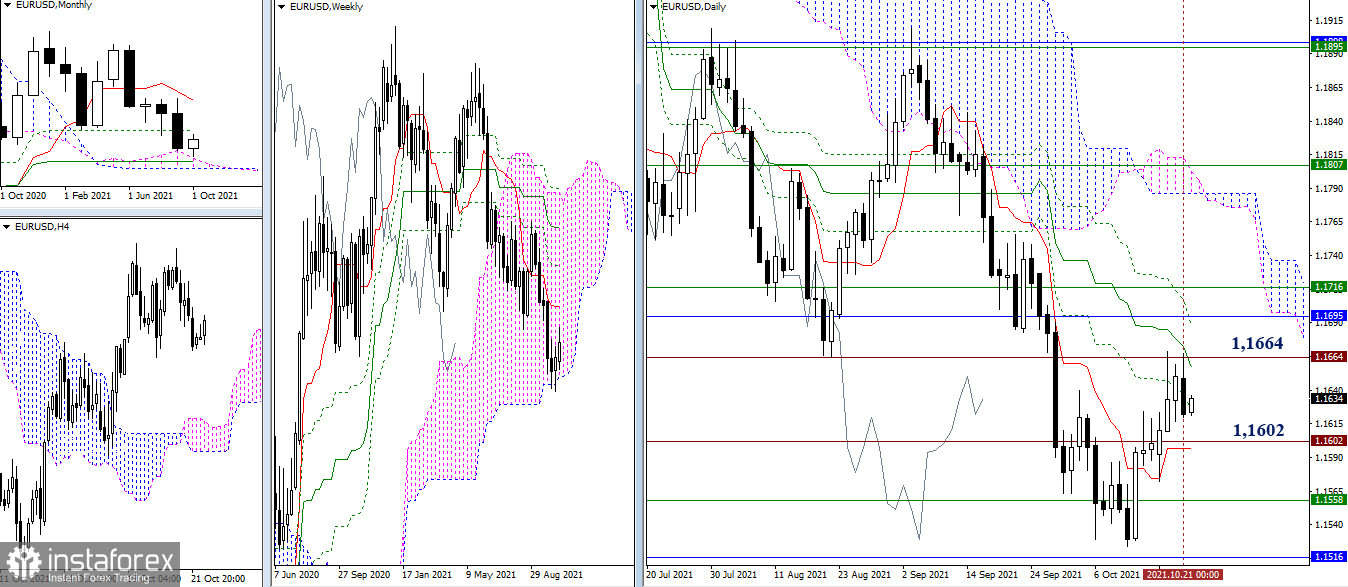
There was a formation of a rebound from the encountered resistance level of 1.1664 on the daily timeframe. A confirmation and development of the rebound will direct the bears' attention to the next support levels of 1.1602 (historical level + daily Tenkan) - 1.1558 (lower border of the weekly cloud) - 1.1516 - 1.1494 (monthly levels). In case of the lack of bearish activity, this may lead to the formation of consolidation and a return to the resistance levels of 1.1664 (historical level + daily Kijun). Here, an important line for the bulls can be noted at the resistance zone 1.1695 - 1.1716 (monthly Fibo Kijun + weekly Tenkan + daily Fibo Kijun).

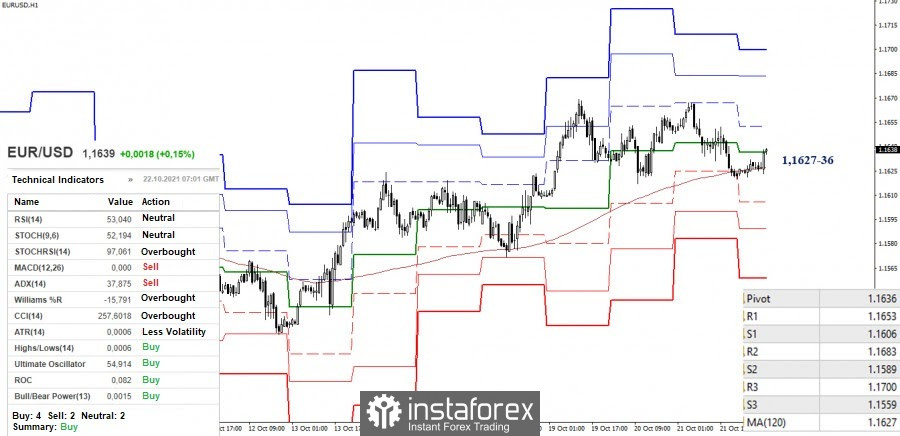
A downward correction on the smaller timeframes led the euro to the key support levels, which are joining forces around 1.1627-36 (central pivot level + weekly long-term trend) today. Trading above these key levels provides a bullish advantage. On the contrary, the breakdown of levels, reliable consolidation below and a reversal of moving averages will contribute to a change in the balance of power and an increase in a bearish mood.
The intraday upward pivot points are the resistances of the classic pivot levels, which are set at 1.1653 - 1.1683 - 1.1700. In turn, the downward targets on the hourly timeframe can be noted at 1.1606 - 1.1589 - 1.1559 (classic pivot levels).
GBP/USD

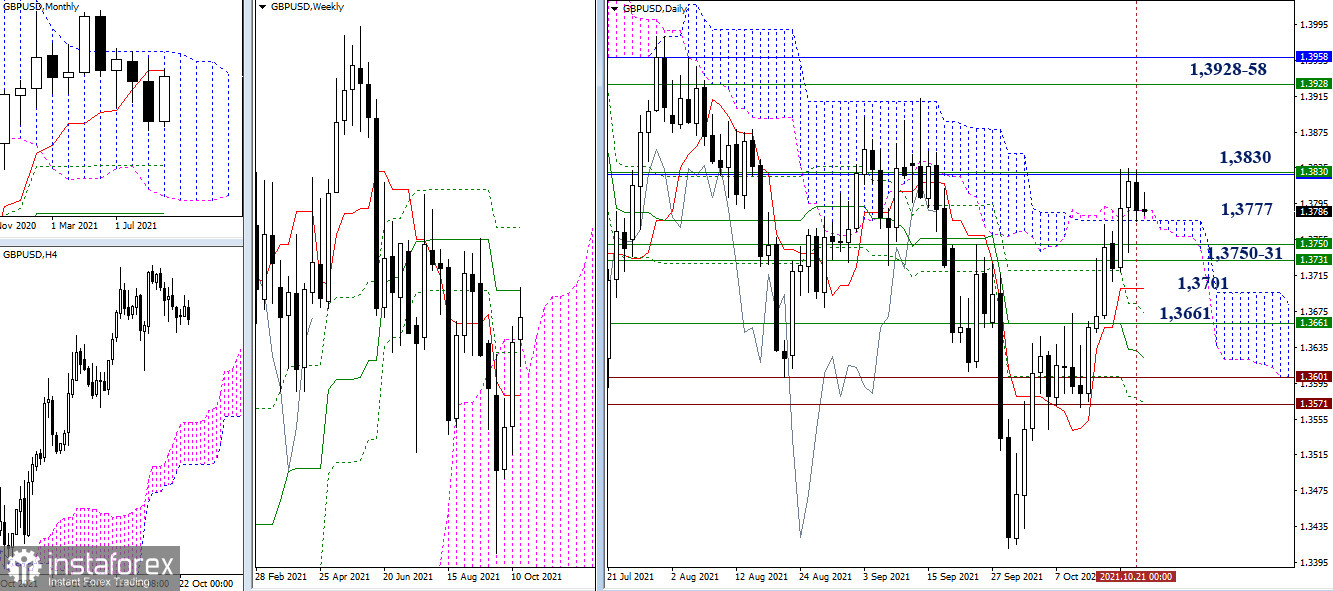
During the last few days, deceleration remains in the area of strong levels – the monthly short-term trend (1.3830) and the weekly medium-term trend (1.3830). The market is now supported by a daily cloud (1.3777). In case of a decline, bears will meet 1.3750 - 31 (weekly levels) - 1.3701 (daily Tenkan) - 1.3661 (weekly Tenkan). A breakdown and reliable consolidation above the area of 1.3830 opens the way to the next resistance levels of 1.3928-58 (the final level of the weekly dead cross + the upper border of the monthly cloud).

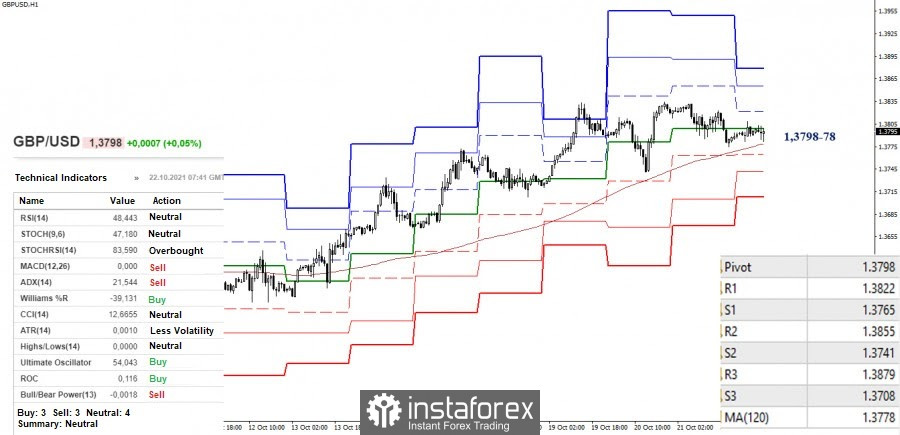
The downward correction brought the pound to interact with the key levels in the smaller periods, which are now joining forces in the area of 1.3798-78 (central pivot level + weekly long-term trend). The analyzed technical indicators are now taking a neutral position and are ready to support any of the parties that will be able to break through the range of 1.3798-78. The downward pivot points are located at 1.3765 - 1.3741 - 1.3708 (classic pivot levels), while the upward ones are at 1.3822 - 1.3855 - 1.3879 (classic pivot levels).
***
Ichimoku Kinko Hyo (9.26.52) and Kijun-sen levels in the higher time frames, as well as classic Pivot Points and Moving Average (120) on the H1 chart, are used in the technical analysis of the trading instruments.


