To open long positions on EUR/USD you need:
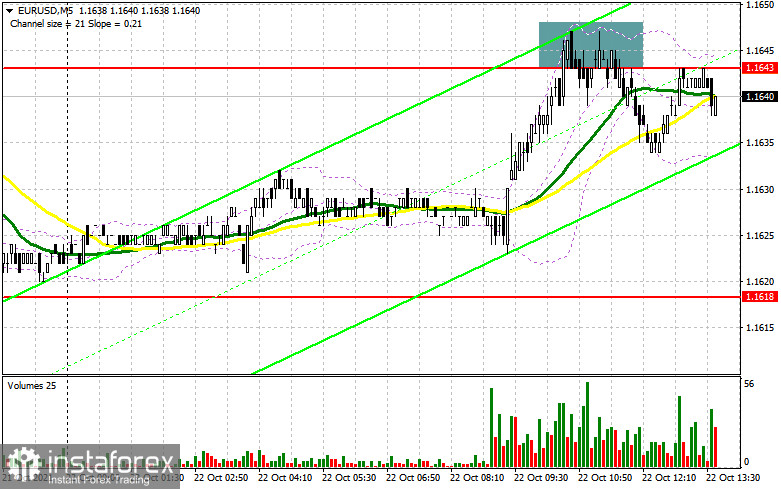
One signal to sell the euro was formed in the first half of the day. Let's observe the 5-minute chart and analyze the entry point. In my morning forecast, I focused on the resistance at 1.1643 and advised to take it into account while making decisions. Bulls did not manage to break above 1.1643 due to varied eurozone activity statistics, which resulted in a false break. However, it has been possible to see a movement down by 10 points so far. As long as the trading will be below this range, the signal testing is expected. From a technical point of view, nothing has changed in the second half of the day.

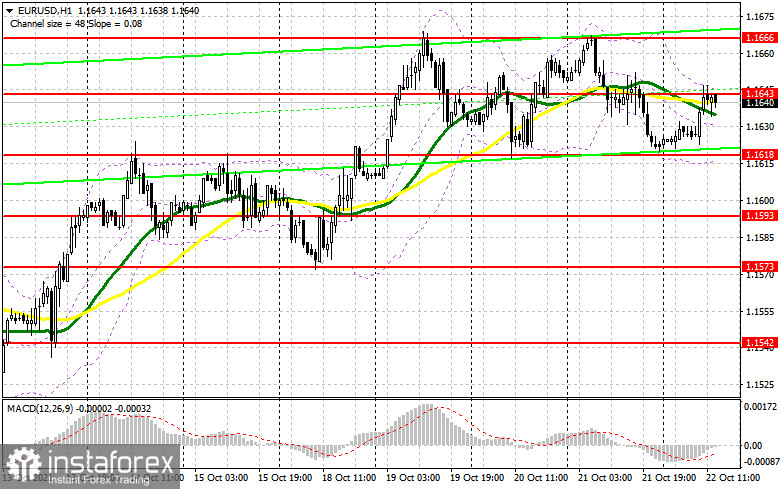
During the US session, similar data on the US manufacturing and service sector activity are due. Strong data may cause further pressure on the US dollar, so the scenario with morning selling signals is likely. As I mentioned in my morning forecast, in order to consider a further recovery of EUR/USD it is necessary to regain control over the middle border of the sideways channel at 1.1643, which resulted in failure in the first half of the day. Only a break and fixation above this range, as well as its return test from the top downward, form a signal to buy the euro. It will be a sign of recovery to the upper boundary of the channel at 1.1666. Besides, the break of this area will indicate a further bullish scenario in the pair, observed since the middle of this month. A test of 1.1666 downwards will open a direct way to the area of the 17th figure, where I recommend taking profit. A further target remains the area of 1.1716. In case the pair's pressure regains, bulls mainly will aim at defending the lower boundary of the sideways channel 1.1618. A false breakdown there will form a good entry point into long positions. In case of lack of buyers activity at this level, I advise to postpone purchases till the area of 1.1593, or even to the low of 1.1573, counting on rebound of 15-20 pips.
To open short positions on EUR/USD you need:
Sellers have managed to break the resistance at 1.1643 and are counting on US strong fundamental economic data. While the trade remains below this range, the euro is likely to fall. Any additional false break at 1.1643 will be profitable for sellers. The situation is similar to yesterday's selling signals, which I analyzed in detail in this morning's review. Bears will focus on the return to the lower border of the side channel at 1.1618. A break and a test of that level from the bottom upwards will form a signal to open new short positions and to end buyers' stop-losses, which are located lower. This will quickly push EUR/USD to 1.1593 and open a chance to climb 1.1673, where I recommend taking profits. A further target will be the area of 1.1542. A test of this range would mean a resumption of the bear market for the euro. In the scenario with no sellers at 1.1643 the best option is to postpone selling to the upper boundary of the channel at 1.1666. It is possible to open short positions on the rebound from a high of 1.1691 immediately, counting on a 15-20 pips downward correction


Indicator Signals:
Moving averages.
Trading is conducted around 30 and 50 daily moving averages, indicating confrontation between buyers and sellers.
Note. Period and prices of moving averages are considered by the author on the hourly chart H1 and differ from the general definition of the classic daily moving averages on the daily chart D1.
Bollinger Bands.
A break of the upper boundary of the indicator at 1.1645 will lead to an immediate recovery of the pair. In the case of the pair's decline the support will be provided by the bottom boundary of the indicator at 1.1618.
Description of indicators
- Moving average (moving average determines the current trend by smoothing out volatility and noise). Period 50. On the chart, it is marked in yellow.
- Moving average (moving average determines the current trend by smoothing out volatility and noise). Period 30. On the chart, it is marked in green.
- MACD (Moving Average Convergence/Divergence - moving average convergence/divergence) Fast EMA period 12. Slow EMA period 26. SMA period 9
- Bollinger Bands (Bollinger Bands). Period 20
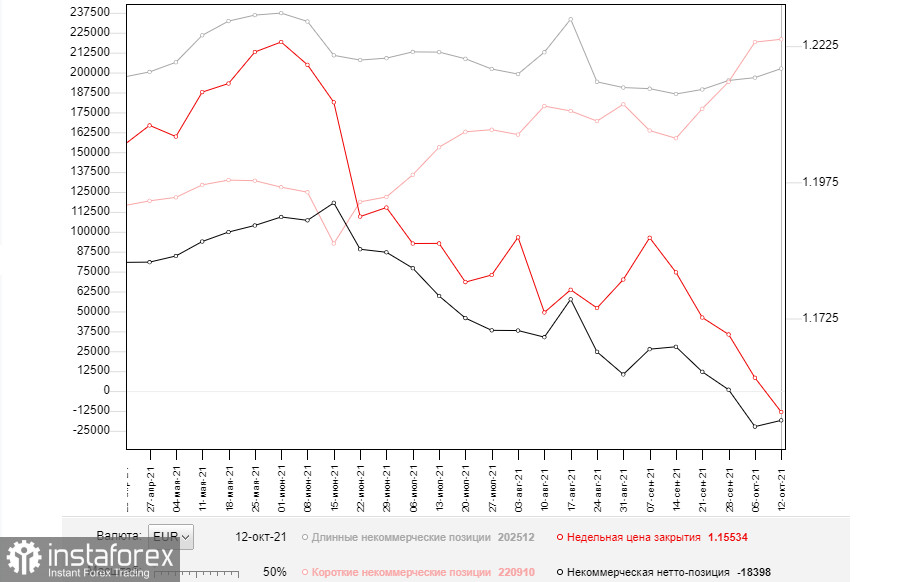
- Non-commercial traders are speculators, such as individual traders, hedge funds and large institutions which use the futures market for speculative purposes and meet certain requirements.
- Long non-commercial positions represent the total long open position of non-commercial traders.
- Short non-commercial positions represent the total short open position of non-commercial traders.
- Total non-commercial net position is the difference between short and long positions of non-commercial traders.


