


Trend analysis (Fig. 1)
The price from the level of 1.3750 (closing of Friday's daily candlestick) is likely to rise today to the target of 1.3792 – the pullback level of 76.4% (yellow dotted line). After this level is reached, its growth may resume to the target of 1.3837 – the pullback level of 85.4% (yellow dotted line).
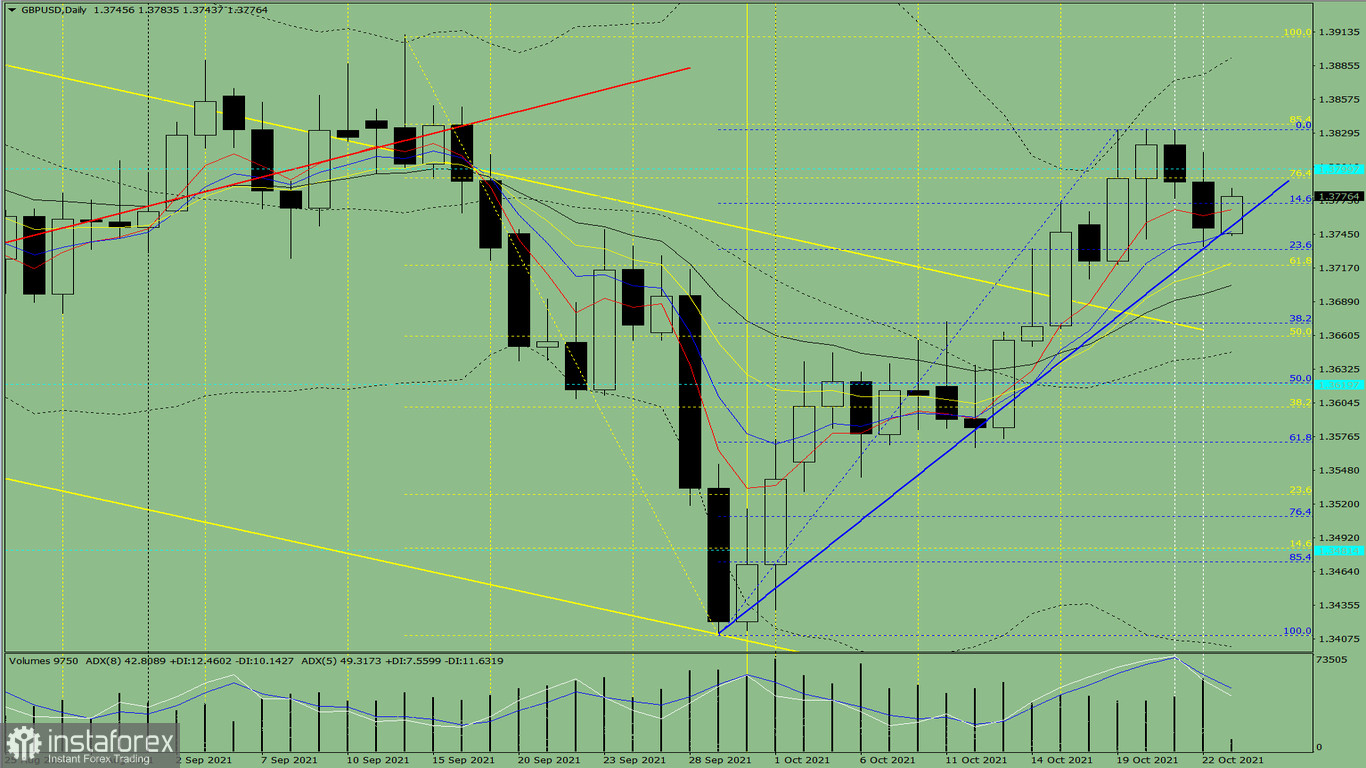
Figure 1 (daily chart)
Comprehensive analysis:
- Indicator analysis - up
- Fibonacci levels - up
- Volumes - up
- Candlestick analysis - up
- Trend analysis - up
- Bollinger lines - up
- Weekly chart - up
General conclusion:
Today, the price from the level of 1.3750 (closing of Friday's daily candlestick) may increase to the target of 1.3792 – the pullback level of 76.4% (yellow dotted line). After reaching it, it may further rise to the target of 1.3837 – the pullback level of 85.4% (yellow dotted line).
Alternatively, it is also possible for the price from the level of 1.3750 (closing of Friday's daily candlestick) to start surging to the target of 1.3792 – the pullback level of 76.4% (yellow dotted line) and then decline to the target of 1.3732 – the pullback level of 23.6% (blue dotted line). After reaching this level, the upward movement may resume.


