


Trend analysis
This week, the price from the level of 1.3750 (closing of the last weekly candlestick) is expected to decline to the target of 1.3671 – the pullback level of 38.2% (blue dotted line). Once this level is reached, the upward movement may resume to the target of 1.3828 – the pullback level of 50.0% (yellow dotted line).
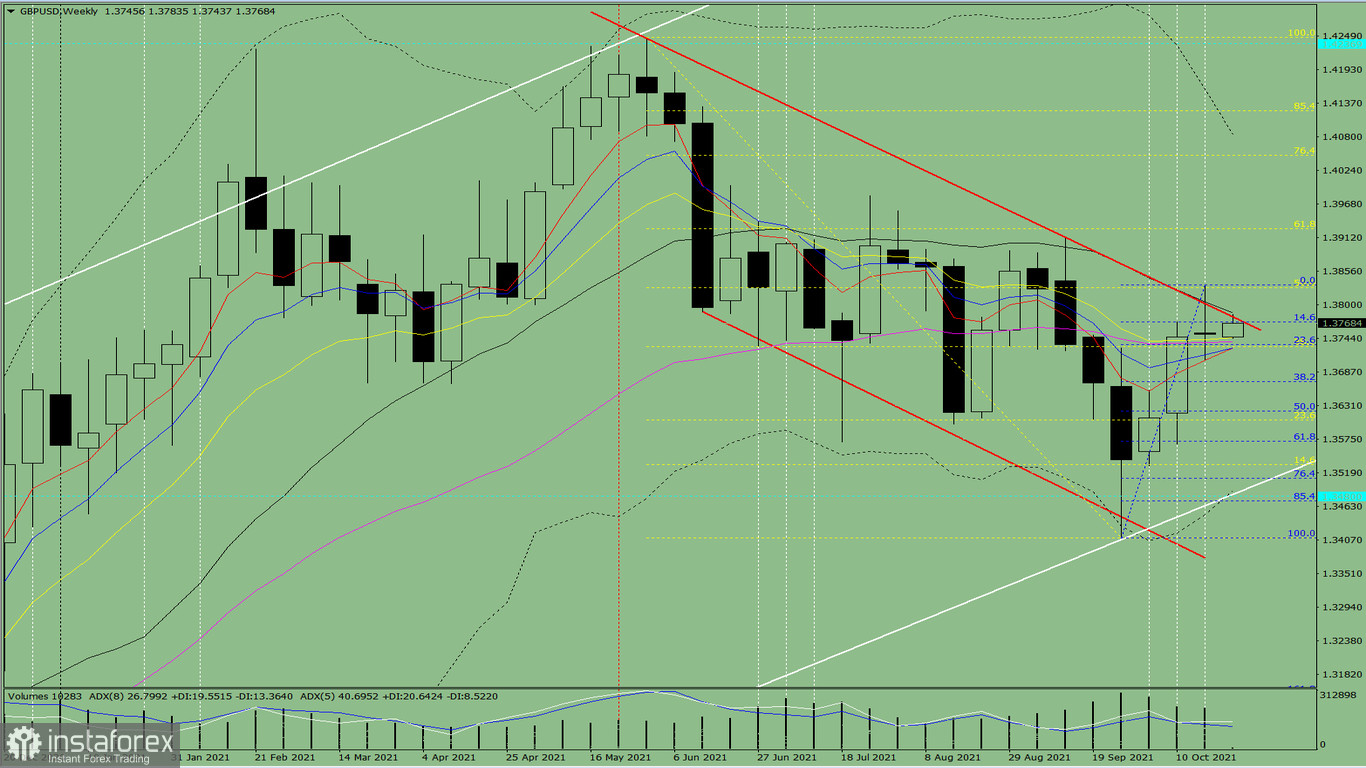
Figure 1 (weekly chart)
Comprehensive analysis:
- Indicator analysis - down
- Fibonacci levels - down
- Volumes - down
- Candlestick analysis - down
- Trend analysis - down
- Bollinger lines - down
- Monthly chart - down
A downward movement can be concluded based on a comprehensive analysis.
The overall result of the candlestick calculation based on the weekly chart: the price will most likely move in a downward trend without the first upper shadow (Monday - down) and with the second lower shadow (Friday - up) in the weekly black candlestick.
This week, the price from the level of 1.3750 (closing of the last weekly candlestick) will fall to the target of 1.3671 – the pullback level of 38.2% (blue dotted line). After that, it may rise again to the target of 1.3828 – the pullback level of 50.0% (yellow dotted line).
As an alternative, the price from the level of 1.3750 (closing of the last weekly candlestick) may decline to the target of 1.3733 – the pullback level of 23.6% (blue dotted line). If this level is reached, it is possible to continue its growth to the target of 1.3828 – the pullback level of 50.0% (yellow dotted line).


