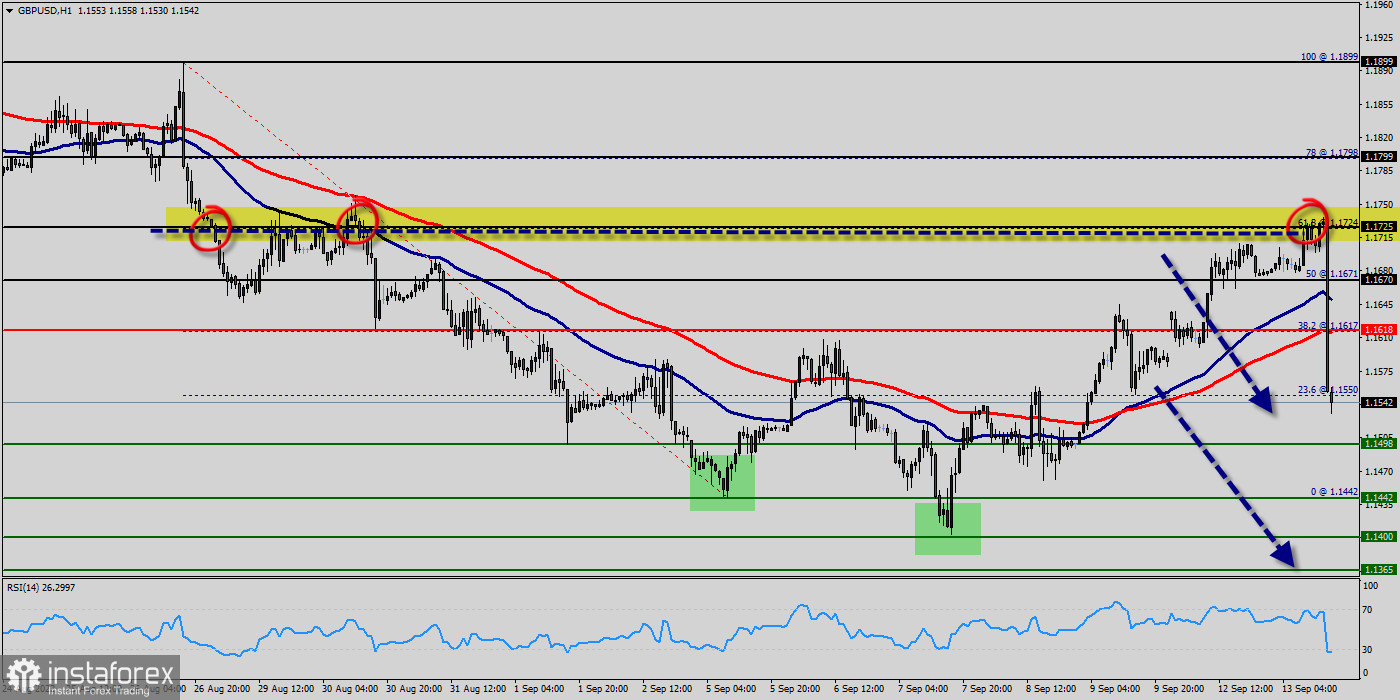
The GBP/USD pair has dropped sharply from the 1.1725 level towards 1.1540. Now, price is set at the 1.1551 to act as a daily pivot point.
It should be noted that the volatility is very high for that the price of the GBP/USD pair is still moving between 1.1618 and 1.1400 in the coming hours.
Furthermore, the price has been set below the strong resistance at the levels of 1.1618 and 1.1670 which coincide with the 38.2% and 50% Fibonacci retracement levels respectively.
The GBP/USD pair traded at 1.1551 this Tuesday 13rd, decreasing from the level of 1.1551 since the previous trading session. The British pound (GBP) has fallen over 3% against the US dollar (USD) since the start of the year. With UK inflation elevated and still rising, the cost of living crisis taking hold, growth slowing and ongoing Brexit woes, the outlook for the pound is deteriorating.
Looking back, over the last weeks, GBPUSD lost 1%. Over the last three weeks, its price fell by 5%. Looking ahead, we forecast British Pound US Dollar to be priced at 1.1442 by the end of this week and at 1.1400 in the end of September.
Additionally, currently the price is in a bearish channel. According to the previous events, the pair is still in a downtrend. From this point, the GBP/USD pair is continuing in a bearish trend from the new resistance of 1.1618 and 1.1670.
Thereupon, the price spot of 1.1618 and 1.1670 remains a significant resistance zone. Therefore, the possibility that the Pound will have a downside momentum is rather convincing and the structure of the fall does not look corrective.
In order to indicate a bearish opportunity below 11.1618 and 1.1670 it will be a good signal to sell below 1.1618 and 1.1670 with the first target of 1.1498. It is equally important that it will call for downtrend in order to continue bearish trend towards 1.1442. Besides, the weekly support 2 is seen at the level of 1.1400.
However, traders should watch for any sign of a bullish rejection that occurs around 1.1724. The level of 1.1724 coincides with 61.8% of Fibonacci, which is expected to act as a major resistance today. Since the trend is below the 61.8% Fibonacci level, the market is still in a downtrend. Overall, we still prefer the bearish scenario.


