


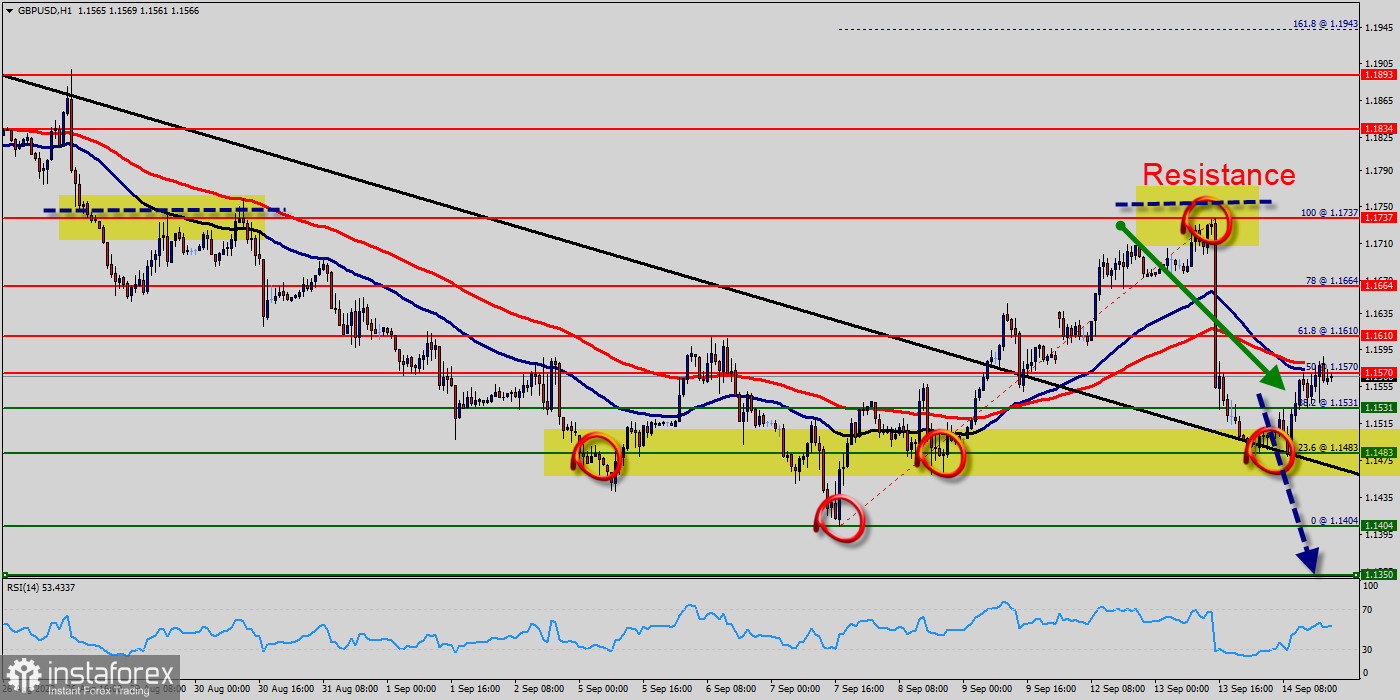
Currently, the GBP/USD is in a position to post a potentially bearish closing price reversal top (at 1.1737), if confirmed, we could see the start in coming two days counter-trend rally.
The move will not change the trend; hence it will alleviate some of the downside pressure. With the main trend down, bearish traders will be looking for a fresh opportunity to set up short positions from the levels of 1.1737, 1.1664 and 1.1610.
On the hourly chart, the GBP/USD pair's down trend is in progress today and reaches as low as 1.1550 so far. Intraday bias stays on the downside. The bias remains bearish in the nearest term testing 1.1531 or lower.
Immediate support is seen around 1.1531. A clear break below that area could lead price to the neutral zone in the nearest term. Price will test 1.1500, because in general, we remain bearish on Sept.14th, 2022.
However, if the pair fails to pass through the level of 1.1610 (major resistance), the market will indicate a bearish opportunity below the strong resistance level of 1.1610 (the level of 1.1610 coincides with the ratio of 61.8% Fibonacci retracement). Since there is nothing new in this market, it is not bullish yet.
Currently, the price is in a bearish channel. This is confirmed by the RSI indicator signaling that we are still in a bearish trending market. As the price is still below the moving average (100). So, the market is likely to show signs of a bearish trend around the spot of 1.1610.
This would suggest a bearish market because the RSI indicator is still in a positive area and does not show any trend-reversal signs.
Sell deals are recommended below the level of 1.1610 with the first target at 1.1531 so as to test the double bottom. If the trend breaks the double bottom level of 1.1531, the pair is likely to move downwards continuing the development of a bearish trend to the level of 1.1483 in order to test the weekly support 1.
The pair will probably go down because the downtrend is still strong. Consequently, the market is likely to show signs of a bearish trend. So, it will be good to re-sell below the level of 1.1483 with the third target at 1.1404 and further to 1.1350.
On the upside, break of 1.1737 minor resistance will turn intraday bias neutral again.
But outlook stays bearish as long as 1.1610 support turned resistance holds. At the same time, the breakup of 1.1610 will allow the pair to go further up to the levels of 1.1737 so as to retest the weekly resistance 2.
Conclusion :
The GBP/USD pair increased within a down channel. Closing below the level of 1.1610 could assure that GBP/USD pair will move lower towards cooling new lows - 1.1531, 1.1483 and 1.1404 (psychological level).


