That's how time flies imperceptibly, and we are already on the threshold of the last autumn month of this year. Considering that last Friday the market closed October trading, today's analysis of the main currency pair will begin with the most senior timeframe. After the close of each month, this is a common practice.
Monthly

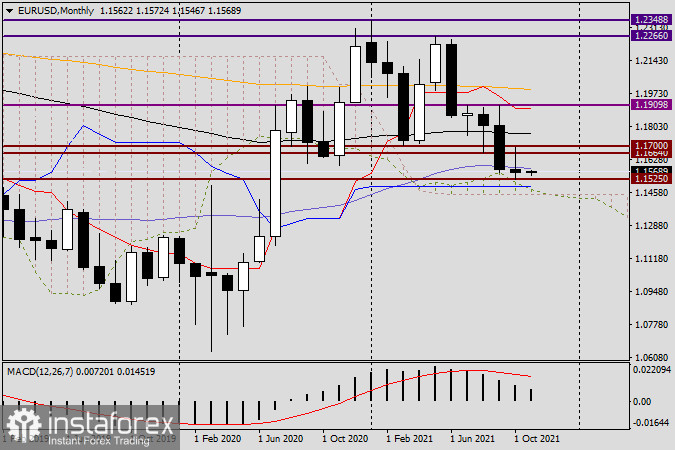
After a very steep September decline, the bears for the pair decided to take a break and ease the pressure on the quote. In addition, it should be noted that the October trading showed the inability of the market to choose or continue the previous directions of the main currency pair of the Forex market. But the euro/dollar once again flashed technology. This refers to a rollback to the broken support level of 1.1664, followed by a rebound down from this very strong technical level. This price behavior certainly fits into a bearish scenario, as well as another (for the second time in a row) candle closed under the dark blue 50 simple moving average. At the same time, there is an achievement. First of all, this is the fact that they maintained the support level of 1.1525 and the most important psychological mark of 1.1500, preventing their opponents from breaking through these two levels. I also recommend paying attention to the shape of the October candle. Despite the rather long upper shadow, after the appearance of such candles, currency pairs experienced growth. However, this is not a rule at all. There are no rules at all in the market, no matter where there are exceptions.
If we summarize the review of the monthly chart, then there are more chances for the continuation or resumption of the downward dynamics, during which the levels of 1.1525, 1.1500, and 1.1470 will be at risk of breakdown. At the same time, I will not be surprised at all by the alternative scenario, during which the pair will return above the levels of 1.1664, 1.1700, and 1.1740/50. And yet, looking at the monthly timeframe, I will give the greatest preference to EUR/USD bears.
Weekly

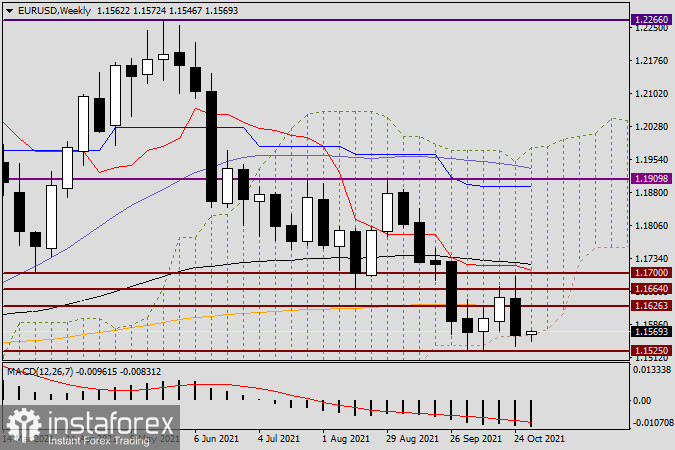
There is an equally intriguing and ambiguous picture on the weekly chart. Yes, during trading on October 25-29, the EUR/USD pair showed a decline, but we did not see a clear downward exit from the weekly Ichimoku indicator cloud. The closing price of the last five days turned out to be exactly on the lower border of the cloud. Considering that the last weekly candle has a lower shadow, it is clear that the bears tried to close the weekly trades under the lower border of the cloud, but they failed to implement their plans. Attempts to return the course above the broken support level of 1.1664 were noted, but all these attempts were limited only to the mark of 1.1670, after which the course turned in a southerly direction. Very strong resistance of sellers takes place in the price zone 1.1670-1.1720, where the highs of last week's trading are marked, and the red Tenkan line of the Ichimoku indicator and the black 89 exponentials moving average pass over the important 1.1700 mark. I still think that only the breakthrough of the 1.1700-1.1750 area with mandatory consolidation is above the last mark. Bears need to break through the strong support level of 1.1525, after which they will transfer trading on EUR/USD to the level of 1.1500. Since two of the most senior timeframes were considered in today's article, I think it is wrong to give trading recommendations on them and even more so points for entering the market. In tomorrow's article, we will look at smaller charts and try to determine the positioning.


