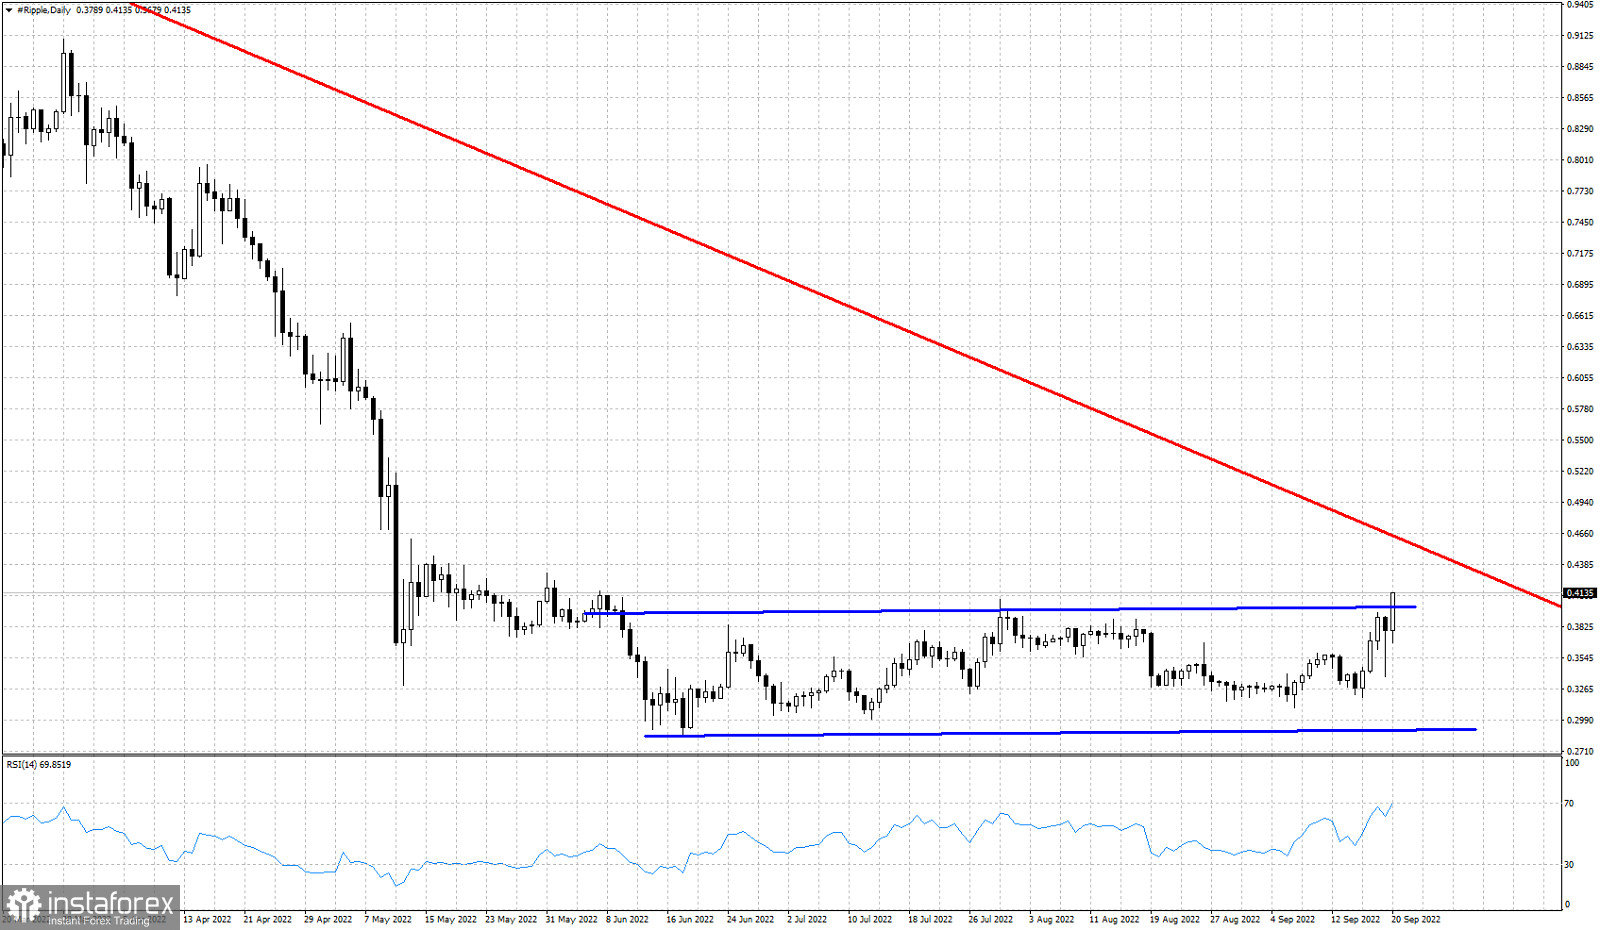
Red line -resistance
Blue lines- trading range
For the last three and a half months XRPUSD has been trading sideways with no clear direction. As we mentioned many times before in our posts, price had formed a trading range between $0.29 and $0.40. Today price is showing break out signs. A daily close above the upper range boundary can lead price at least towards $0.47. The red resistance trend line is at $0.47. So a test of this trend line is very possible. Bulls do not want to see a rejection at $0.46 or a decline below yesterday's candle. Yesterday's low at $0.3375 is very critical. Breaking below it will open the way for a move below $0.28. The first step for a major trend reversal and bottom is for price to break above the red resistance trend line. Yes XRPUSD could continue higher but bulls are not out of danger yet.


