Simplified wave analysis and forecast for EUR/USD, USD/JPY, GBP/JPY, GOLD on November 8
EUR/USD
Analysis:
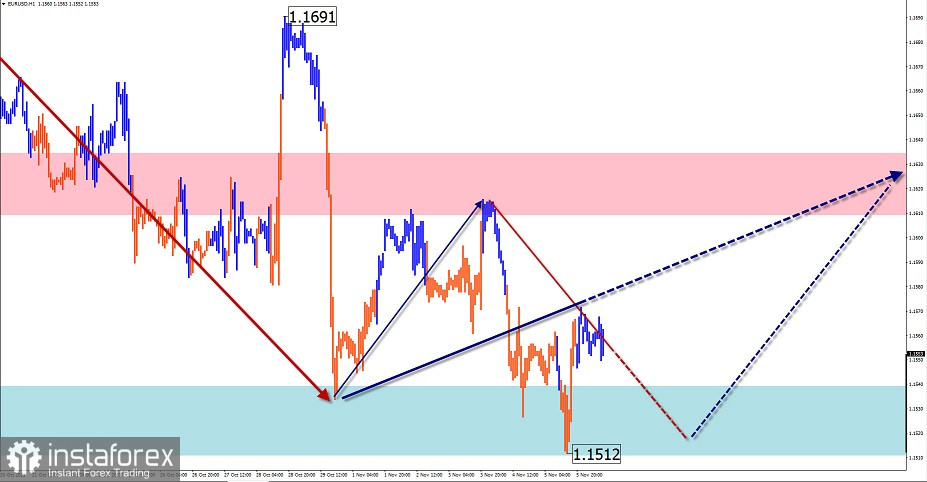
The downward wave of the major European currency, which began on January 6, led the pair's quotes to the area of a strong reversal zone of a large TF. On October 29, a section of the chart with a reversal potential was formed towards the main course. This may be the beginning of a new wave of counter direction.
Forecast:
Today, a predominantly sideways course of price movement is expected. A short-term decline is not excluded in the next session, no further than the support zone. The growth rate is likely at the end of the day or tomorrow.
Potential reversal zones
Resistance:
- 1.1610/1.1640
Support:
- 1.1540/1.1510
Recommendations:
Trading on the euro market today is possible only within the framework of individual trading sessions with a fractional lot. After the appearance of reversal signals, short-term purchases from the support zone will become possible.

USD/JPY
Analysis:
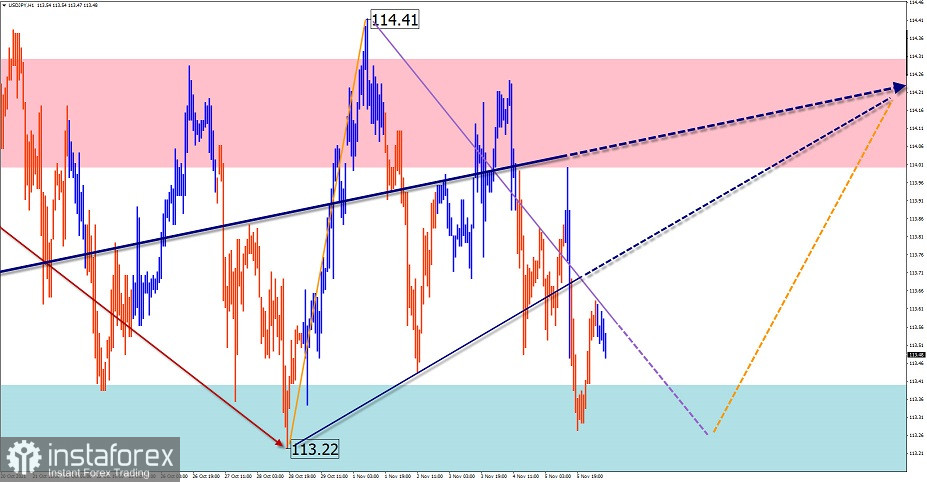
The dominant uptrend since the beginning of this year has brought the quotes of the Japanese yen to the area of strong resistance on a large scale. The price has been adjusted laterally for the past month.
Forecast:
The general sideways course of price movement is expected to continue today. During the day, you can wait for the price to move from the lower border of the price corridor to the upper one.
Potential reversal zones
Resistance:
- 114.00/114.30
Support:
- 113.40/113.10
Recommendations:
Today, short-term purchases from the support zone are possible in the Japanese yen market. The lifting potential is limited by the calculated resistance zone.

GBP/JPY
Analysis:
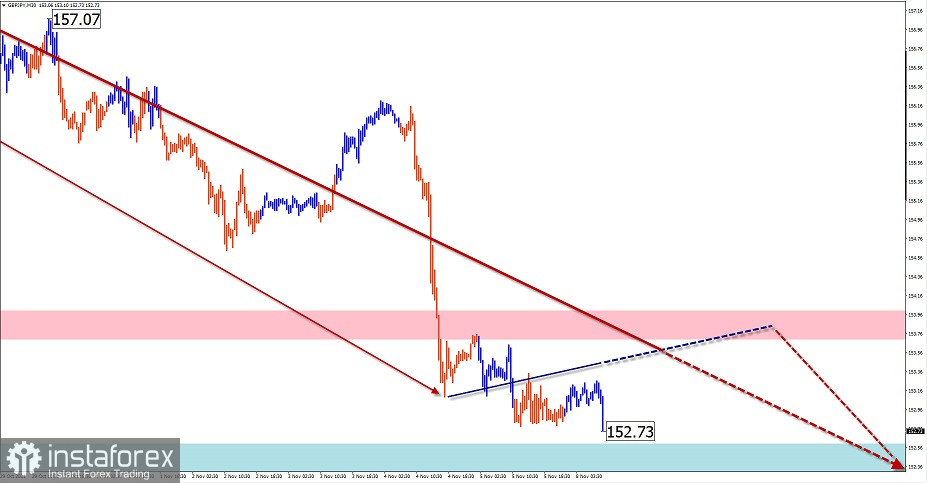
Over the past year, the price of the pound/yen has been steadily moving up. Since October 20, the pair's quotes have been declining, forming an intermediate correction. By today, the price has reached the upper limit of support for the weekly scale of the chart.
Forecast:
In the coming sessions, a general sideways course of price movement is likely. In the first half of the day, a short-term growth to the resistance zone is possible. Then you can wait for a return to the bearish rate of movement.
Potential reversal zones
Resistance:
- 153.70/154.00
Support:
- 152.60/152.30
Recommendations:
Short-term sales from the resistance zone will be possible in the pair's market today. Purchases can lead to losses and are not recommended.

GOLD
Analysis:
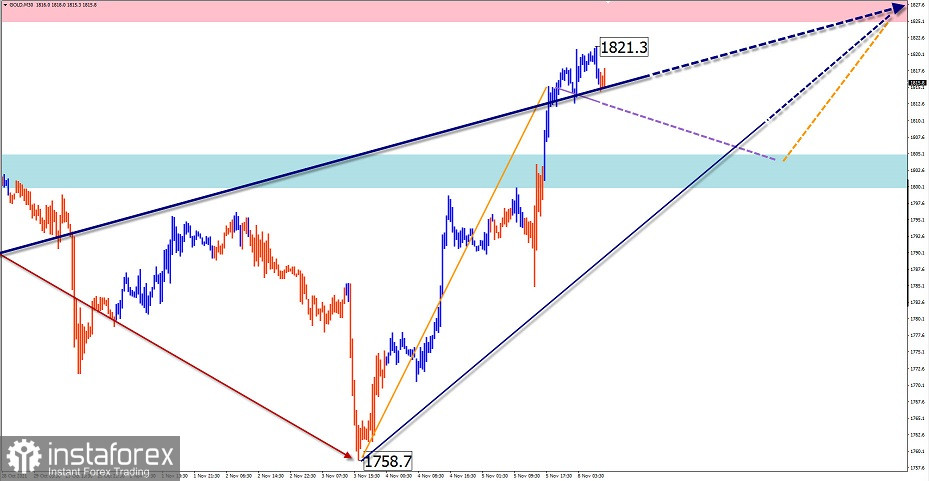
An incomplete wave construction of a small scale on the gold ascending chart, dated August 9. The final part (C) is formed in the structure of this wave. The wave does not look complete at the time of analysis. The price has reached the boundaries of the intermediate resistance.
Forecast:
On the next day, the price fluctuations of the instrument are expected to move mainly to the side plane. In the first half of the day, a downward vector is more likely. The resumption of price growth can be expected by the end of the day or tomorrow.
Potential reversal zones
Resistance:
- 1825.0/1830.0
Support:
- 1805.0/1800.0
Recommendations:
Trading on the gold market in flat conditions can lead to losses and is not recommended. It is optimal to wait for the price decline to complete and then look for buy signals in the area of the support zone.

Explanations: In the simplified wave analysis (UVA), waves consist of 3 parts (A-B-C). The last incomplete wave is analyzed. The solid background of the arrows shows the formed structure, and the dotted one shows the expected movements.
Attention: The wave algorithm does not take into account the duration of the movements of the instrument in time!


