


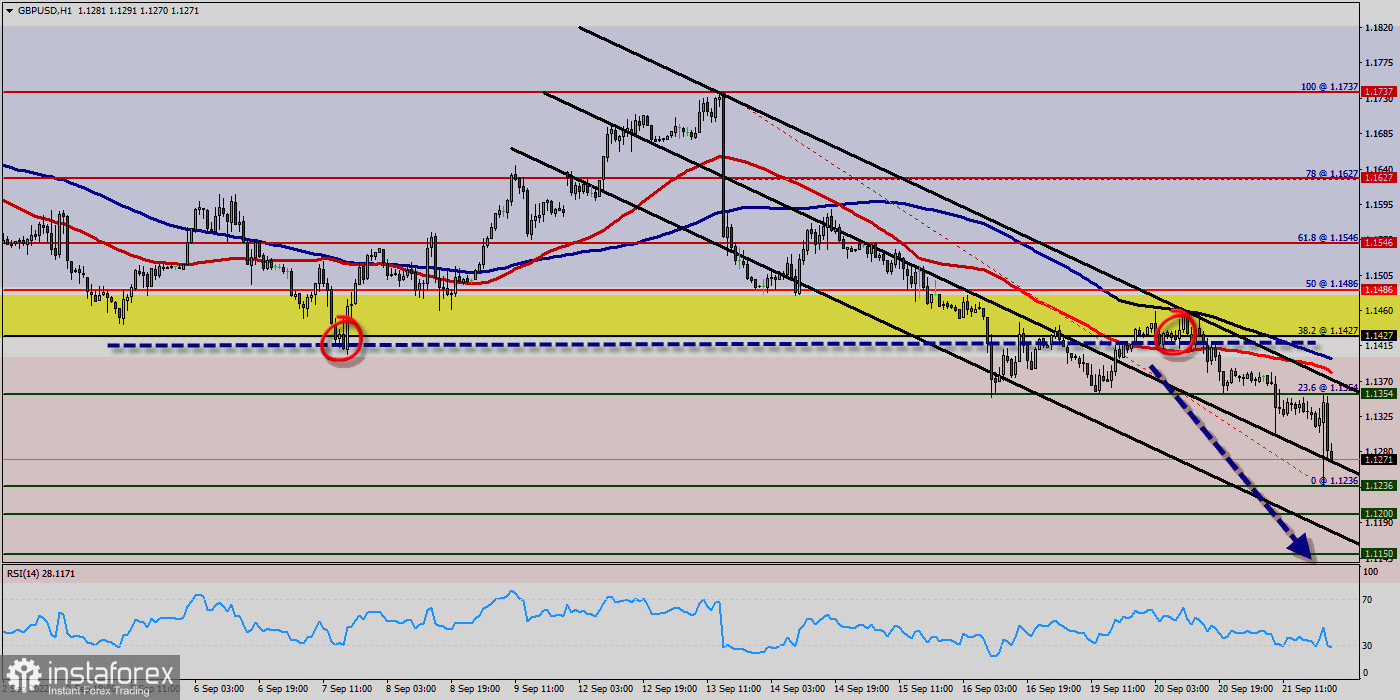
The GBP/USD pair dropped from the level of 1.1427 to the bottom around 1.1236. But the pair has rebounded from the bottom of 1.1236 to close at 1.1264. Today, the first support level is seen at 1.1236, and the price is moving in a bearish channel now.
Furthermore, the price has been set below the strong resistance at the level of 1.1427, which coincides with the 38.2% Fibonacci retracement level. This resistance has been rejected several times confirming the downtrend. Additionally, the RSI starts signaling a downward trend.
As a result, if the GBP/USD pair is able to break out the first support at 1.1236, the market will decline further to 1.1200 in order to test the weekly support 2.
The pair will probably go down because the downtrend is still strong. Consequently, the market is likely to show signs of a bearish trend. The strong resistance is seen at the level of 1.1861 because it represents the weekly resistance 1.
Equally important, the RSI and the moving average (100) are still calling for a downtrend. Therefore, the market indicates a bearish opportunity at the level of 1.1236 in the H1 chart.
So, it will be good to sell below the level of 1.1236 with the first target at 1.1200 and further to 1.1150.
This would suggest a bearish market because the RSI indicator is still in a negative area and does not show any trend-reversal signs. The pair is expected to drop lower towards at least 0.9953 in order to test the second support (0.9900).
The US Dollar and the Euro are two of the most prominent and well-known currencies in the world. The Euro versus US Dollar (EUR/USD) currency pair has the largest global trading volume, meaning it is the world's most-traded currency pair. Whether you find the instrument easy or difficult to trade on, it's not a pair that many traders neglect, due to its daily volatility and price movement.
At the same time, the breakup of 1.1427 will allow the pair to go further up to the levels of 1.1486 in order to retest the weekly resistance 2. Always remember that the market analysis posted here is meant to increase your awareness, but not to give instructions to make a trade.
Forecast (GBP/USD) :
The volatility is very high for that the GBP/USD is still moving between 1.1354 and 1.1150 in coming hours. Consequently, the market is likely to show signs of a bearish trend again. Hence, it will be good to sell below the level of 1.1300 with the first target at 1.1200 and further to 1.1150 in order to test the daily support 2. However, if the GBP/USD is able to break out the daily support at 1.1427, the market will rise further to 1.1486 to approach support 2 next week.
Conclusion :
Downtrend scenario :
On the downside, the 1.1427 level represents resistance. The next major resistance is located near the 1.1427, which the price may drift below towards the 1.1427 resistance region. The breakdown of 1.1236 will allow the pair to go further down to the prices of 1.1200 and 1.1150.


