GBP/USD
Analysis:
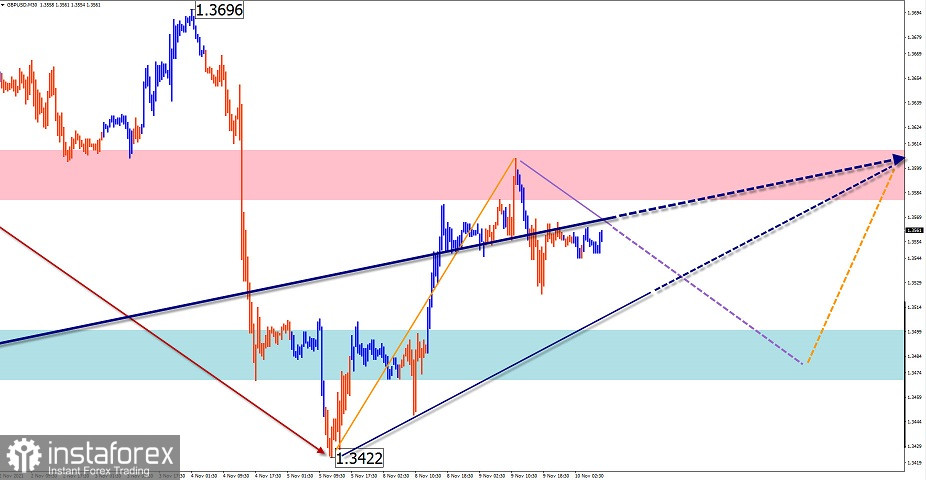
On the chart of the main pair, the direction for the short-term trend of the British pound is set by the suitable wave from September 29. Its structure has formed the first two parts (A-B). The upward section from November 5 has a reversal potential.
Forecast:
A general sideways movement is expected in the next 24 hours. By the end of the day it is possible to expect the resumption of price growth from the support zone.
Potential reversal zones
Resistance:
- 1.3580/1.3610
Support:
- 1.3500/1.3470
Recommendations:
Selling the British pound is risky and may lead to losses. It is recommended not to enter the market until there are buying signals near the calculated support

AUD/USD
Analysis:
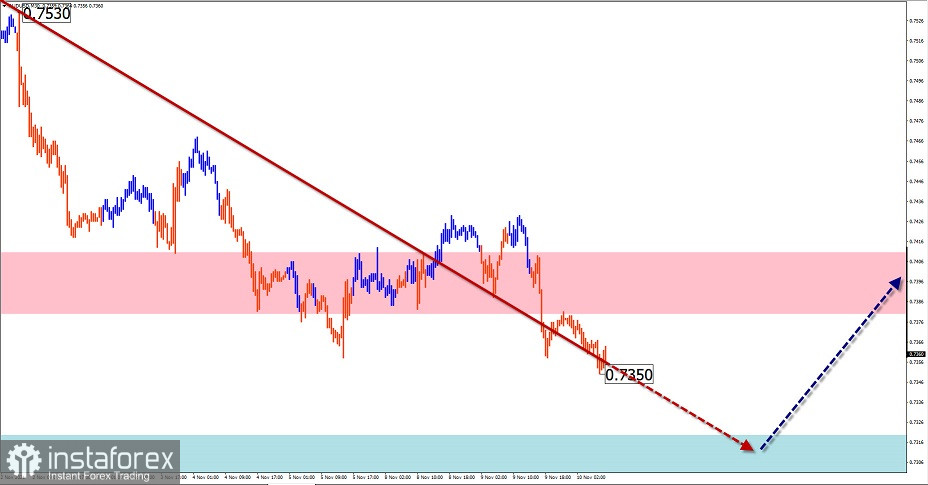
The general algorithm of the short-term movements of the main Australian dollar pair's chart is set by the ascending wave from August 20. The price is correcting down from the strong resistance zone since October 21. The movement entered its final phase.
Forecast:
In the coming trading sessions, a further downward movement vector is expected, up to the full completion of the bearish course near the support zone. In the first half of the day a short-term price growth in the resistance area is likely.
Potential reversal zones.
Resistance:
- 0.7380/0.7410
Support:
- 0.7320/0.7290
Recommendations:
Today, trading on the Australian dollar market is possible only within individual trading sessions. It is better to reduce the used lot. It is recommended not to trade until there are clear buying signals near the support area.

USD/CHF
Analysis:
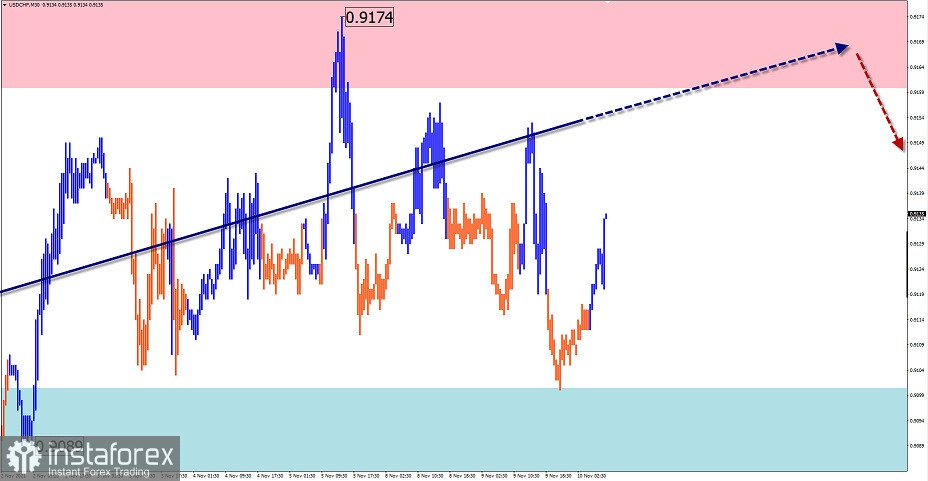
On the chart of the Swiss franc, an unfinished wave pattern is a bearish wave from June 18. It is formed as a plane, shifting or expanding. It is difficult to determine accurately as the structure of the wave lacks a final part. For the last two weeks the price in a flat sideways corridor is accumulating forces for the final downward break.
Forecast:
Today, a further general sideways course of the pair's movement is expected. In the second half of the day, an upward vector is possible. A breakout beyond the boundaries of the price corridor within the current day is unlikely.
Potential reversal zones
Resistance:
- 0.9160/0.9190
Support:
- 0.9100/0.9070
Recommendations:
Today, trading on the Swiss franc market is possible only in the form of short-term pipsing transactions from the borders of the price corridor. Selling the pair is more promising.

USD/CAD
Analysis:
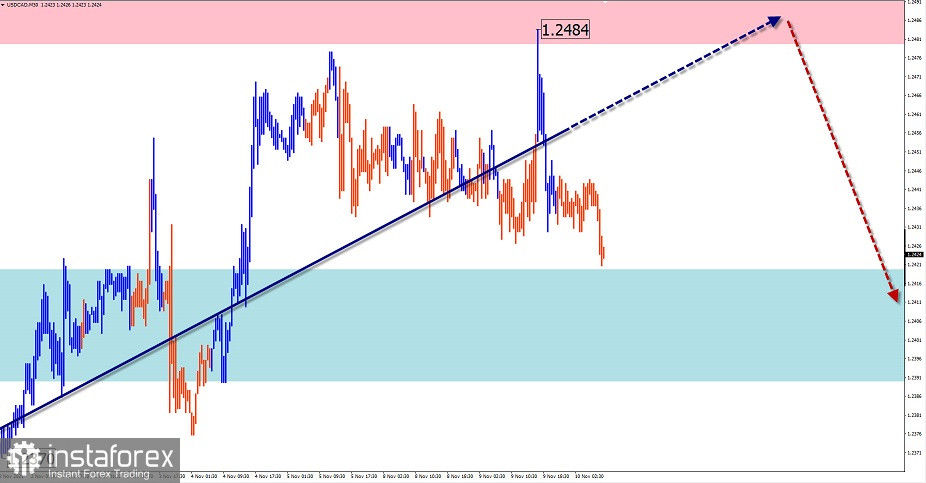
The Canadian dollar's quotes in the pair with the US currency from July 19 form a descending wave on the chart. Over the past three weeks, the price has been forming a counter correction. Its structure is close to completion.
Forecast:
In the next day, the price is expected to continue moving in a sideways corridor between the opposite zones. In the first half of the day, a short-term rise up to the resistance levels is possible. Return to the trend rate can be expected not earlier than tomorrow.
Potential reversal zones.
Resistance:
- 1.2480/1.2510
Support:
- 1.2420/1.2390
Recommendations:
Trading on the Canadian dollar market is risky until the completion of the current correctional wave. It is better to await selling signals in the area of calculated resistance.

Explanation: In the simplified wave analysis (UVA), waves consist of 3 parts (A-B-C). The last incomplete wave is analyzed. The solid background of the arrows shows the formed structure and the dotted background shows the expected movements.
Note: The wave algorithm does not take into account the duration of the instrument's movements in time!


