To open long positions on GBP/USD, you need:
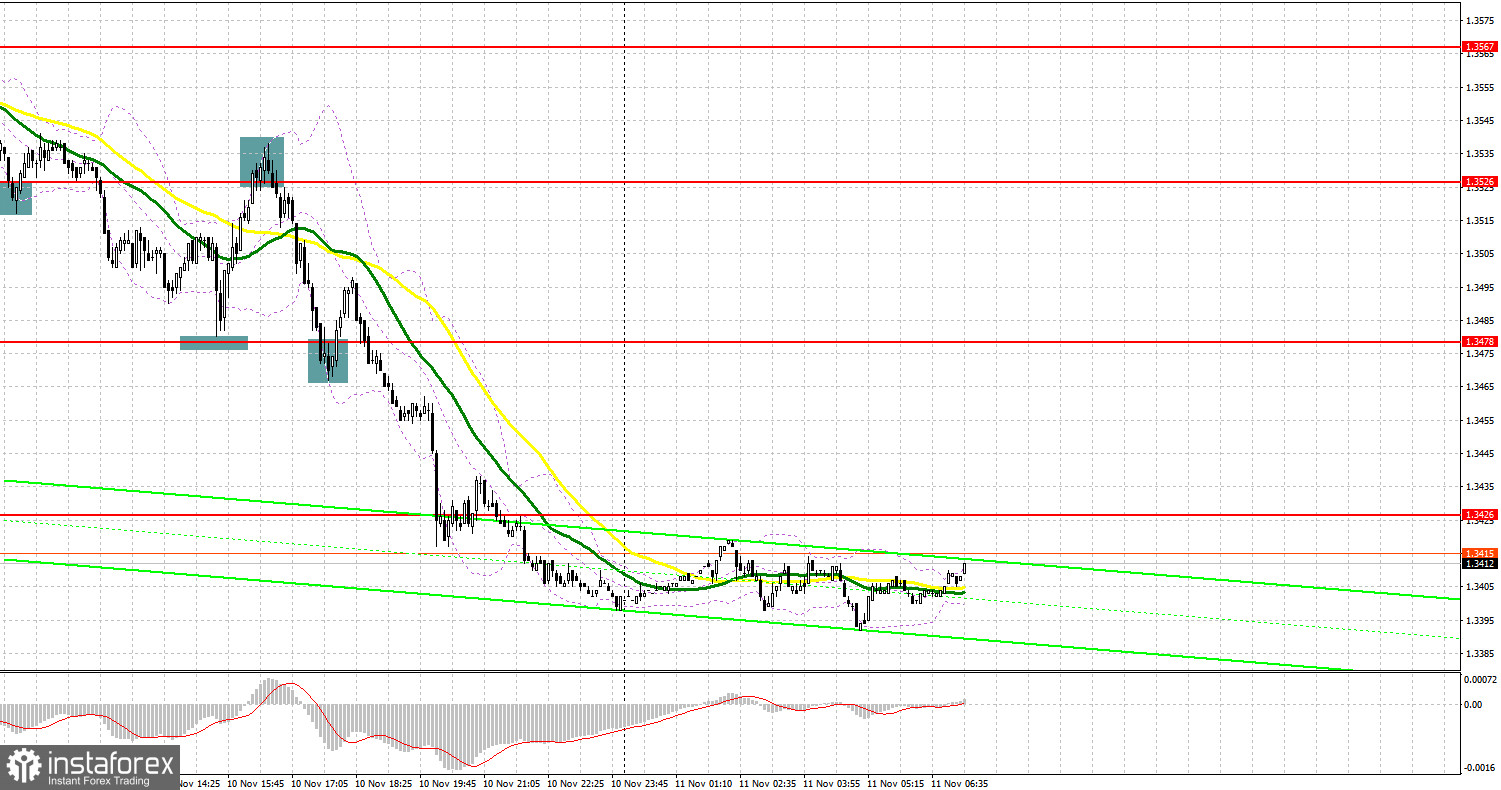
Yesterday there was a fairly large number of signals to enter the market. Let's look at the 5-minute chart and figure out all the entry points. The buy signal that was formed in the first half of the day did not lead to the expected result, although the entry point was simply excellent. It is clearly seen how the bulls defend the support of 1.3526 and form a false breakout there, which leads to the formation of a signal to open long positions and to the growth of the pound by 15 points. That was the end of it. After a while, the pair returned to this range again and broke through it, but there was no update from the bottom up, so I did not wait for a signal to sell the pound. We fell just a bit short of the 1.3478 support, where I advised buying on a false breakout, so there was no buy signal there either. Strong data on inflation in the US came out in the second half of the day, so a false breakout at 1.3526 was very useful, which resulted in forming a sell signal and to the fall in the area of 1.3478. The bulls tried to protect the market in this range, which formed a good point to buy the pound, but alas, it brought losses and the pair continued to fall.

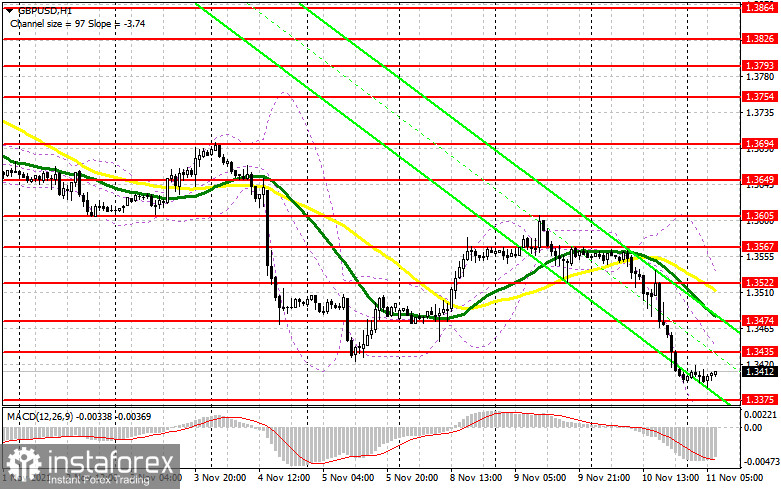
Today we have important statistics on UK GDP and a number of other smaller reports, which may lead to additional pressure on the British pound. The fact that traders continue to monitor the situation developing around the Brexit agreement does not add confidence to the bulls. If the British continue to insist on renegotiating the agreement, the fall of the pound will not be avoided. The bulls' main task for the first half of the day is to protect 1.3375. Forming a false breakout there, together with the divergence on the MACD indicator, creates a signal to buy the pound against the trend, which will return the chance of an upward correction of the pair to the area of 1.3435. An equally important task is to regain control of this level. A breakthrough and a reverse test from the top down of this range will give a signal to buy the pound, which will lead to the movement of GBP/USD up to the area of 1.3474 with the prospect of reaching a high like 1.3522, where I recommend taking profits. There are moving averages that limit the upward potential. In case the pair falls in the first half of the day and the deterioration of the situation around Brexit, the best option for buying the pound will be a test of the next support of 1.3308. However, I advise you to open long positions there only after a false breakout. You can watch GBP/USD long positions immediately for a rebound from the new low of 1.3254, or even lower - from the support of 1.3193, counting on a correction of 25-30 points within the day.
To open short positions on GBP/USD, you need:
Bears control the market and it is better to trade further along the newly formed trend with an upward correction from large levels. All bears need to continue the downward trend is a breakthrough and a reverse test of 1.3375 from the bottom up, which forms a signal to open new short positions in order to fall to a low like 1.3308. Weak fundamental data on the growth rates of the UK economy in October this year will only increase the pressure on the pound, and a similar breakthrough of 1.3308 will form another point for opening short positions with a goal of reaching 1.3254 and 1.3193, where I recommend taking profits. If the pair grows during the European session, forming a false breakout around 1.3435 will give an excellent signal to sell the pound. If we see the growth of GBP/USD above this level, it is best to postpone short positions to a larger resistance of 1.3474, where the moving averages are playing on the side of the bears. I advise you to open short positions immediately for a rebound from 1.3522, or even higher - from a new high in the area of 1.3567, counting on the pair's rebound down by 20-25 points within the day.

I recommend for review:
The Commitment of Traders (COT) reports for November 2 revealed an increase in both short and long positions, reflecting the return of demand for the British pound ahead of the BoE meeting, which took place last week. Considering that there are more bulls and they continue to return to the market, we can count on the continued upward correction of the pair. Many BoE officials are speaking this week and are already starting to make converse statements disagreeing with BoE Governor Andrew Bailey's policies. Let me remind you that after the BoE's November meeting, monetary policy remained completely unchanged, although many traders were betting on tightening it by the end of the year. In this regard, sharp inflationary pressures will continue to support the demand for the British pound. Therefore, I recommend adhering to the strategy of buying the pair in case of very large falls, which will occur against the background of uncertainty in the policy of the central bank. The COT report indicated that long non-commercial positions rose from 51,912 to 57,255, while short non-commercials also strengthened slightly from 36,959 to 42,208. This led to an upward shift in the non-commercial net position. The delta was 15,047 against 14,953 a week earlier. The weekly closing price of GBP/USD dropped significantly as a result of the BoE's policy from 1.3763 to 1.3654.
Indicator signals:
Moving averages
Trading is carried out below 30 and 50 moving averages, which indicates a continuation of the bear market.
Note: The period and prices of moving averages are considered by the author on the H1 hourly chart and differs from the general definition of the classic daily moving averages on the daily D1 chart.
Bollinger Bands
In case of growth, the upper border of the indicator in the area of 1.3522 will act as a resistance. In case of a decline, support will be provided by the lower border at 1.3370.
Description of indicators
- Moving average (moving average, determines the current trend by smoothing out volatility and noise). Period 50. It is marked in yellow on the chart.
- Moving average (moving average, determines the current trend by smoothing out volatility and noise). Period 30. It is marked in green on the chart.
- MACD indicator (Moving Average Convergence/Divergence — convergence/divergence of moving averages) Quick EMA period 12. Slow EMA period to 26. SMA period 9
- Bollinger Bands (Bollinger Bands). Period 20
- Non-commercial speculative traders, such as individual traders, hedge funds, and large institutions that use the futures market for speculative purposes and meet certain requirements.
- Long non-commercial positions represent the total long open position of non-commercial traders.
- Short non-commercial positions represent the total short open position of non-commercial traders.
- Total non-commercial net position is the difference between short and long positions of non-commercial traders.


