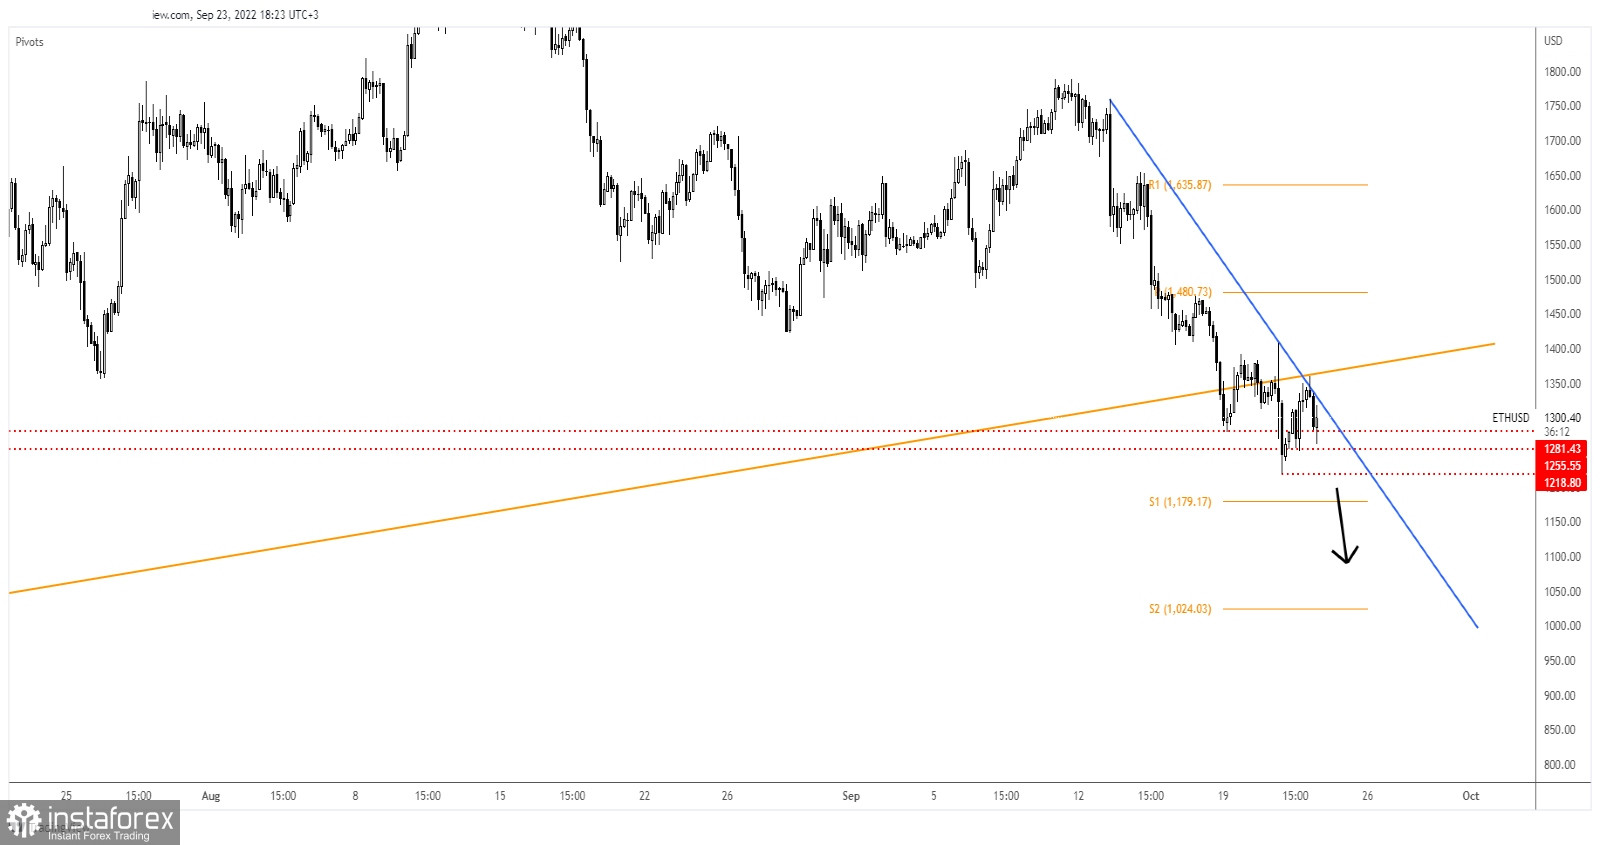
Ethereum was located at 1,303 at the time of writing. It has changed little in the short term but the bias remains bearish. Technically, the altcoin is at crossroads, it has reached a strong demand zone.
In the last 24 hours, ETH/USD is up by 2.40% but it's down by 10.36% in the last 7 days. As you already know, the price of Bitcoin remains bearish, a deeper drop could force Ethereum to approach and print new lows as well.
ETH/USD Confirmed Its Breakdown!

Technically, ETH/USD dropped below the uptrend line signaling more declines. It has tested and retested the broken uptrend line but the 1,255 - 1,281 historical levels represent downside obstacles.
As you can see on the H4 chart, it has failed to stabilize below these obstacles. Now, it has retested the downtrend line which represents a dynamic resistance. As long as it stays under the downtrend line, ETH/USD could extend its sell-off.
ETH/USD Forecast!
ETH/USD could resume its sell-off after making a valid breakdown below the 1,218 former low. This scenario brings potential short opportunities.


