


Analysis of previous deals:
30M chart of the GBP/USD pair
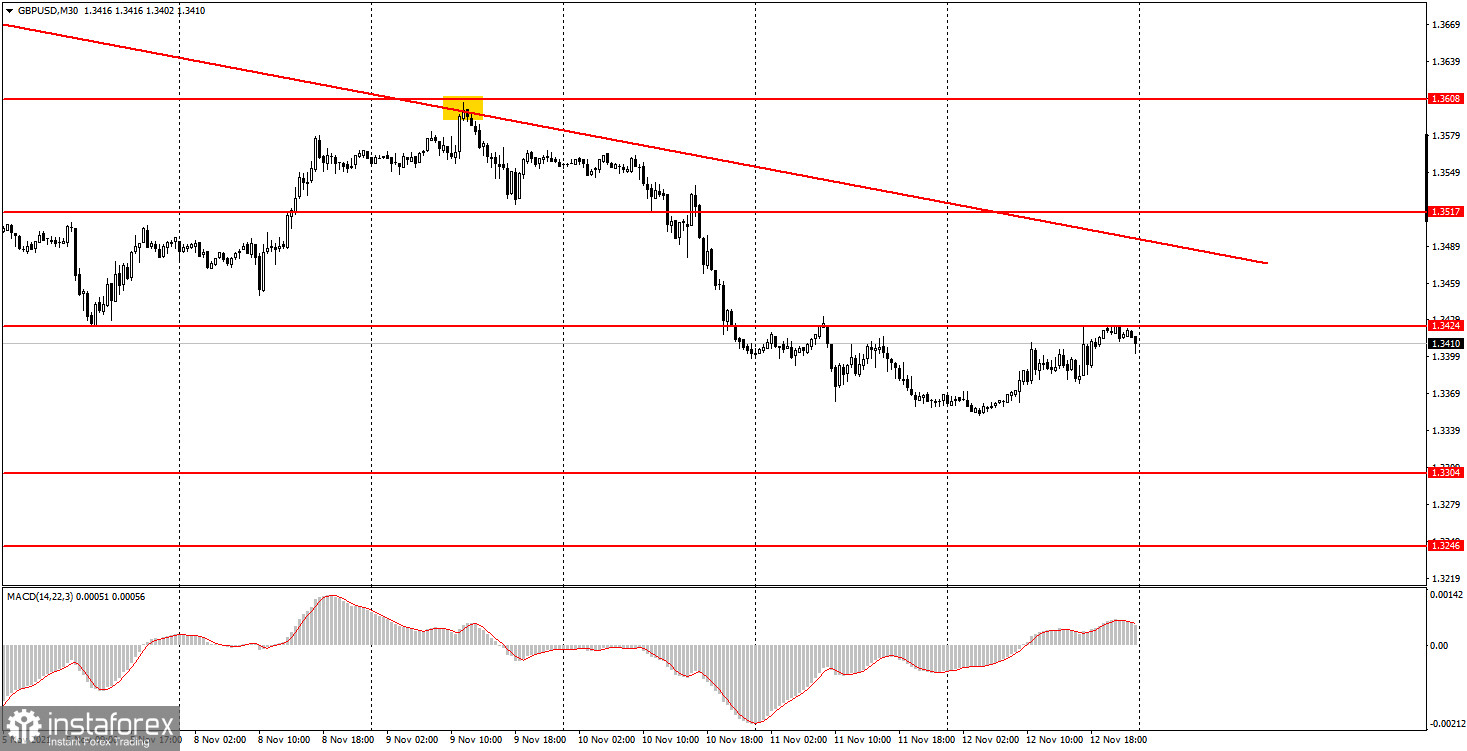
The GBP/USD pair corrected on the 30-minute timeframe on Friday, November 12. This correction was the logical end of the trading week. Recall that the pound is still in a strong downward trend with a trend line, from which the price has rebounded several times. Since no trend can be recoilless, an upward movement on Friday, especially after a strong fall on Tuesday, Wednesday and Thursday, was absolutely logical. At the moment, the pair has corrected to the level of 1.3424, from which it can bounce to resume its downward movement. Correction to the trend line may also continue. Therefore, for now, we are still considering the option with a further drop in the pound. There were no interesting macroeconomic publications on Friday. There were also no fundamental events. Therefore, traders had nothing to react to during the day. It will be possible to speak about the end of the downward trend only after the price settles above the trend line. Volatility on Friday was rather weak for the pound. Only 70 points.
5M chart of the GBP/USD pair
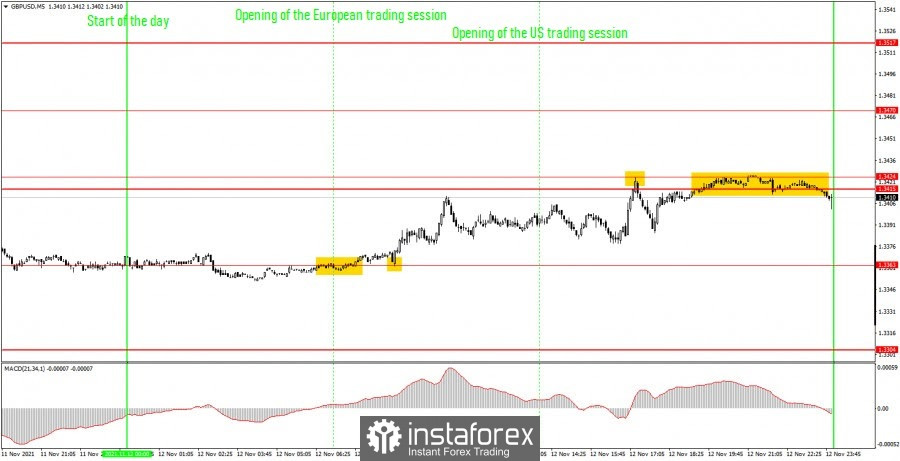
There were at least three trading signals on the 5-minute timeframe on Friday. And they were good enough and profitable. Let's take a look at them and understand how you should trade. The first buy signal was formed at the very beginning of the European trading session in the form of a rebound from the level of 1.3363. And within an hour, it was duplicated by another rebound from the same level. Therefore, it should have been worked out with long positions. After the formation of this signal, the pair went up exactly 50 points, and also reached the levels of 1.3415 and 1.3424, from which it rebounded. Thus, novice traders could get 40-50 pips of profit on this trade in almost any case. At least by Take Profit, or by manual closing. On the signal of a rebound from the level of 1.3424, a deal should also have been opened, but already for short positions. However, this time the price moved in the right direction by only 23 points, which was enough only to set Stop Loss to breakeven. The deal was closed on this order, as the price returned to the levels of 1.3415 and 1.3424. Thus, neither profit nor loss was received on the second deal.
How to trade on Monday:
At this time, the downward trend continues on the 30-minute timeframe. Now we need to understand whether the pair will be able to overcome the level of 1.3424, from which it rebounded several times in the past. If yes, then the upward movement will continue, if not, then the downward movement will resume. On the 5-minute timeframe, the important levels are 1.3304, 1.3363, 1.3415-1.3424, 1.3470, 1.3517. We recommend trading on them on Monday. The price can bounce off them or overcome them. As before, we set Take Profit at a distance of 40-50 points. At the 5M TF, you can use all the nearest levels as targets, but then you need to take profit, taking into account the strength of the movement. When passing 20 points in the right direction, we recommend setting Stop Loss to breakeven. Novice traders will have nothing to pay attention to on November 15, since nothing interesting is planned for the first trading day in America and Great Britain.
Basic rules of the trading system:
1) The signal strength is calculated by the time it took to form the signal (bounce or overcome the level). The less time it took, the stronger the signal.
2) If two or more deals were opened near a certain level based on false signals (which did not trigger Take Profit or the nearest target level), then all subsequent signals from this level should be ignored.
3) In a flat, any pair can form a lot of false signals or not form them at all. But in any case, at the first signs of a flat, it is better to stop trading.
4) Trade deals are opened in the time period between the beginning of the European session and until the middle of the US one, when all deals must be closed manually.
5) On the 30-minute TF, using signals from the MACD indicator, you can trade only if there is good volatility and a trend, which is confirmed by a trend line or a trend channel.
6) If two levels are located too close to each other (from 5 to 15 points), then they should be considered as an area of support or resistance.
On the chart:
Support and Resistance Levels are the Levels that serve as targets when buying or selling the pair. You can place Take Profit near these levels.
Red lines are the channels or trend lines that display the current trend and show in which direction it is better to trade now.
The MACD indicator consists of a histogram and a signal line. When they cross, this is a signal to enter the market. It is recommended to use this indicator in combination with trend lines (channels and trend lines).
Important speeches and reports (always contained in the news calendar) can greatly influence the movement of a currency pair. Therefore, during their exit, it is recommended to trade as carefully as possible or exit the market in order to avoid a sharp price reversal against the previous movement.
Beginners on Forex should remember that not every single trade has to be profitable. The development of a clear strategy and money management are the key to success in trading over a long period of time.


