Taking advantage of the fact that today is the first trading day of the new week, and on Friday the market closed the last five days, we will pay attention to another major currency pair dollar/franc. Since the external background is very sparse, I suggest focusing on the technical component and conducting an appropriate analysis starting from the weekly timeframe.
Weekly

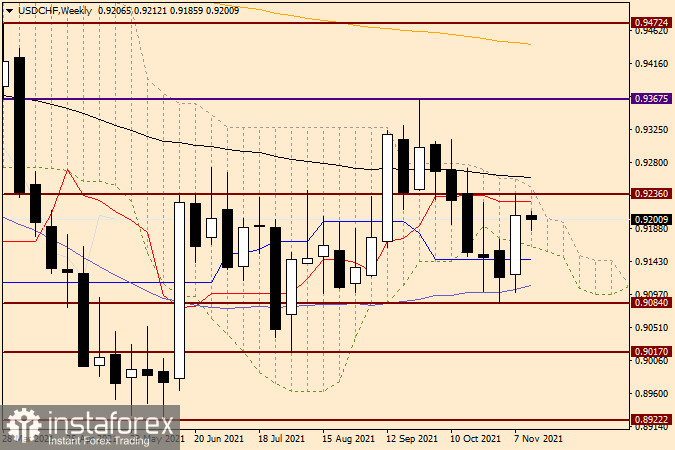
The strengthening of the US dollar at the auction on November 8-12 was not spared by the Swiss franc, which fell significantly in price against the US currency. However, in my personal opinion, there have not been any significant changes in the technical picture on the weekly chart so far. For three weeks in a row, the USD/CHF pair has been trading in the range of 0.9084-0.9236. At last week's auction, the maximum values were shown at 0.9236, and here it is necessary to mark one of the lines of the Ichimoku indicator again. This time it is the red Tenkan line, which is below the level of 0.9236. I have almost no doubt that it was Tenkan who did not let the pair go higher. In turn, strong support for the quote was provided by the 50 simple moving average, which runs at one of the important and key levels of 0.9100. Another important technical point is that the pair returned above the blue Kijun line of the Ichimoku indicator, and also again found itself within the cloud of this indicator.
To implement a bullish scenario, it is necessary to exit up from the cloud with a true breakdown of the black 89 exponential moving average, which is located just above the upper boundary of the cloud and may complicate the exit from it up. Bears need to break through the 0.9100 and 50 MA mark, after which they break through the 0.9084 support level. Only if these conditions are met, the prerequisites for further movement in the south direction will appear, where the nearest target will be a strong and extremely important price zone of 0.9020-0.9000. Based on the technical picture on the weekly chart, it is extremely difficult to draw unambiguous conclusions about the further direction of the price. I think a lot will depend on the breakdown of 0.9260 (89 EMA) or the support level of 0.9084. Nevertheless, the ascending scenario, judging by the weekly timeframe, still looks a little more preferable.
Daily

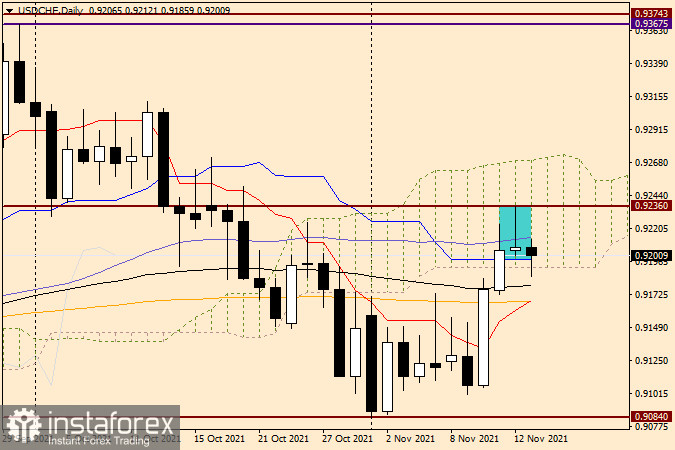
On the daily chart, we see a highlighted candle that formed on Friday, November 12. Taking into account the candle analysis, this candle can be characterized as a "Tombstone" reversal model. I note that this model is quite strong and the market often plays it back. How it will be this time, the bidding process will show. Additional reinforcement of this reversal model of candle analysis is provided by the closing price of the selected candle below 50 MA, as well as a very long upper shadow. And indeed, at the time of writing this article, the players on the downgrade began to play the candle model "Tombstone." However, the blue Kijun line and the lower border of the Ichimoku indicator cloud at the time of the completion of the article restrain all the efforts of the bears.
If we turn to trade recommendations, then the current situation for the USD/CHF pair for opening positions is ambiguous. There are both bullish and bearish signals, so I recommend taking a wait-and-see position for now and not rushing into the market. In case of breaking the bearish reversal pattern tombstone and closing daily trading above 0.9236, there will be a good chance for further growth to the upper limit of the daily cloud, which runs near 0.9270. If the market chooses a downward scenario, which so far appears to be more of a corrective one, from the 0.9180-0.9170 price zone, when the corresponding candle signals appear there on this or smaller charts, I recommend considering options for opening long positions. That's all for now.


