


Wave pattern
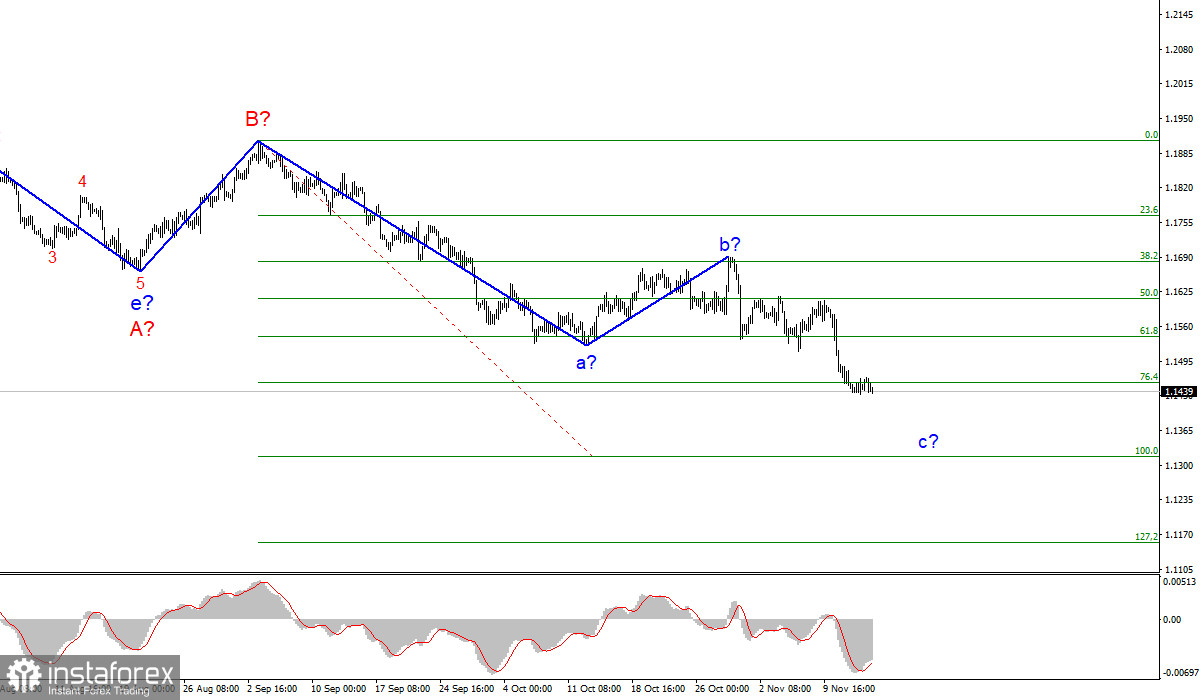
The wave marking of the 4H chart for the euro/dollar pair remains integral. The a-b-c-d-e line, which has been forming since the beginning of the year, may be wave A. The subsequent increase of the instrument is repressed by wave B. Thus, wave C is being formed now. It may also take a very extended form. Its internal corrective wave b has taken a more complex form than initially expected. However, the subsequent decline in the pair, which is presumably a wave c to C, looks like the entire wave markup. Wave c may also take the extended form like wave a. Its target levels are located below the 15th pattern, up to the 13th. A successful breakout of the 1.1455 mark, which corresponds to the 76.4% Fibonacci retracement level, indicates the readiness of speculators to open short positions on the pair. Wave C may also take a shortened form. Yet, this is rather an alternative scenario.
Last Thursday, Friday, and Monday trading unfolded rather sluggishly
The economic calendar for EUR/USD has been empty in recent days. Perhaps this partly explains the fact that the pair's trajectory hit the anti-records. On Thursday, it was 23 basis points, on Friday- 13 points, on Monday - 15. Thus, the pair had remained unchanged for the last three days. Apart from that, the economic calendar was also empty. On Monday, Christine Lagarde, the President of the European Central Bank, delivered a speech in the European Parliament. However, traders mainly ignored it as it contained nothing new. She points out that inflation is likely to remain high for more time than the regulator has expected amid supply chain disruptions, high energy prices, demand exceeding supply. Importantly, inflation in the European Union is not as high as in the UK or the US. However, it may also continue to rise. However, high inflation is unlikely to adversely affect the euro. In the US, the consumer price index reached a 30-year high. Nevertheless, the US dollar is gaining momentum now. ECB Vice President Luis de Guindos also made a speech today. Yet, it was even less informative. Tomorrow, market activity may increase as the EU is going to unveil reports on GDP for the third quarter and employment. The US will reveal retail sales and industrial output data. Christine Lagarde will also make a speech on Tuesday. However, traders will mainly focus on the US retail sales report. They may even ignore other reports.
Conclusion
Judging by the wave analysis, the construction of the descending wave C will continue. Its internal corrective wave b has been completed. Therefore, it is recommended to open short positions for each sell signal from the MACD indicator. The target levels are located near 1.1314, which corresponds to the 100.0% Fibonacci retracement level.
Larger timeframe
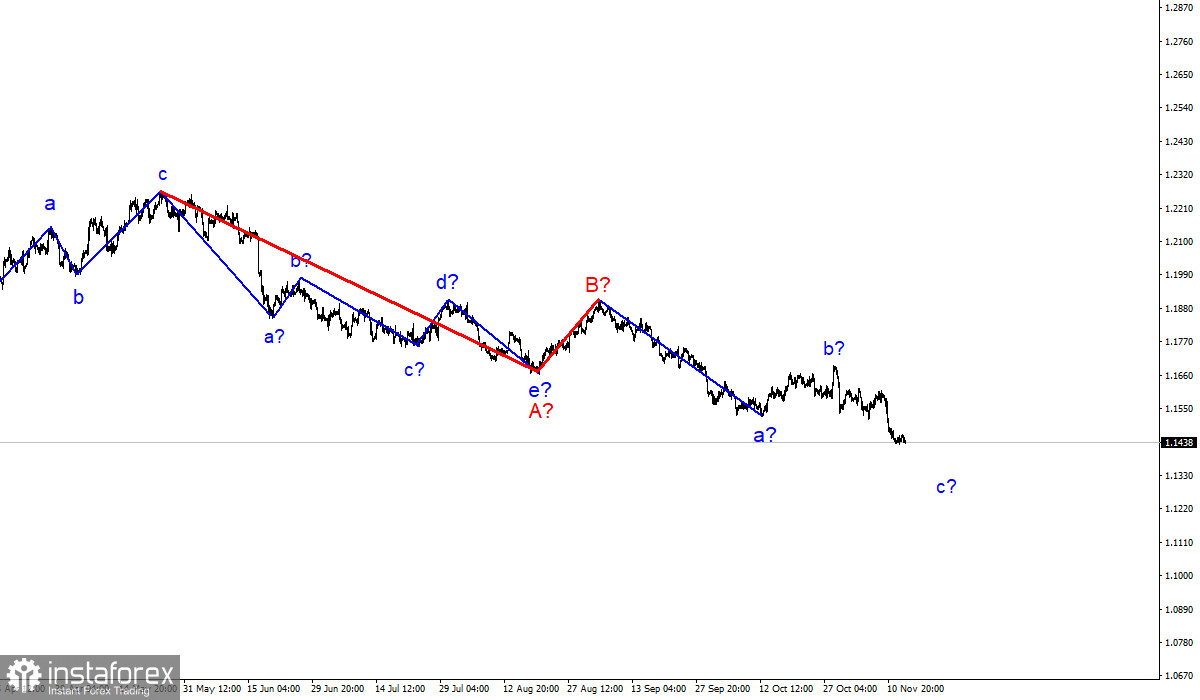
The wave marking of the larger timeframes looks quite convincing. The decline in the pair continues. The downward section of the trend, which appeared on May 25, has taken the form of a three-wave correction structure A-B-C. Thus, the downward movement may last for another month or two until Wave C is formed.


