


Trend analysis (Fig. 1)
The price rising from the level of 1.1367 (closing of yesterday's daily candle) will try to reach the level of 1.1437 – the pullback level of 14.6% (yellow dotted line) today. After that, it will most likely continue to increase to the target of 1.1486 – the pullback level of 23.6% (yellow dotted line).
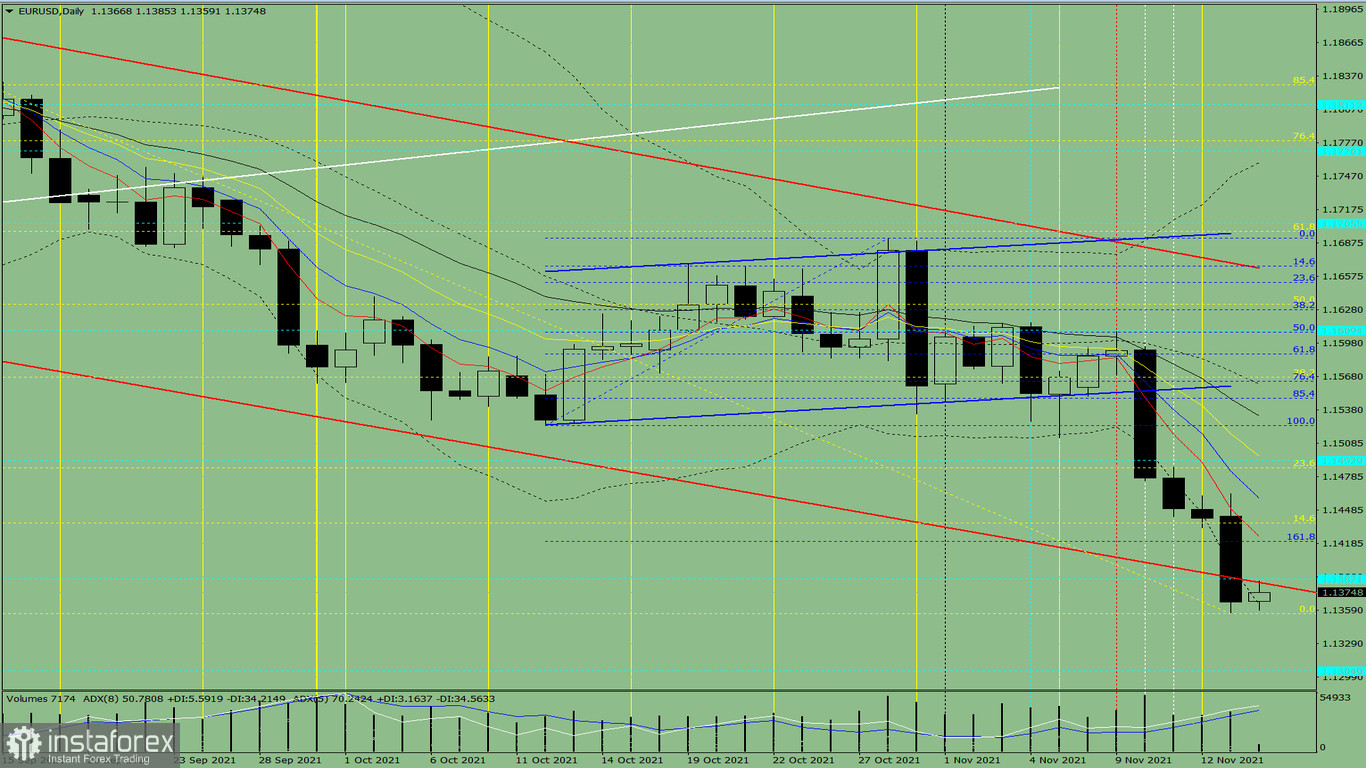
Figure 1 (daily chart)
Comprehensive analysis:
- Indicator analysis - up
- Fibonacci levels - up
- Volumes - up
- Candlestick analysis - up
- Trend analysis - up
- Bollinger lines - up
- Weekly chart - up
General conclusion:
Today, the price moving up from the level of 1.1367 (closing of yesterday's daily candle) will try to reach the level of 1.1437 – the pullback level of 14.6% (yellow dotted line). After that, the upward trend will most likely resume to the target of 1.1486 – the pullback level of 23.6% (yellow dotted line).
Alternatively, the price from the level of 1.1367 (closing of yesterday's daily candle) will attempt to further rise to the target of 1.1305 – the historical support level (blue dotted line). After testing this level, the price can start rising to the target of 1.1387 – the historical resistance level (blue dashed line).


