


Trend analysis (Fig. 1)
Today, the price from the level of 1.3410 (closing of yesterday's daily candle) will make an attempt to further rise to the target of 1.3466 – the pullback level of 23.6% (yellow dotted line). Once this line is tested, the upward movement will continue to the target of 1.3537– the pullback level of 38.2% (yellow dotted line).
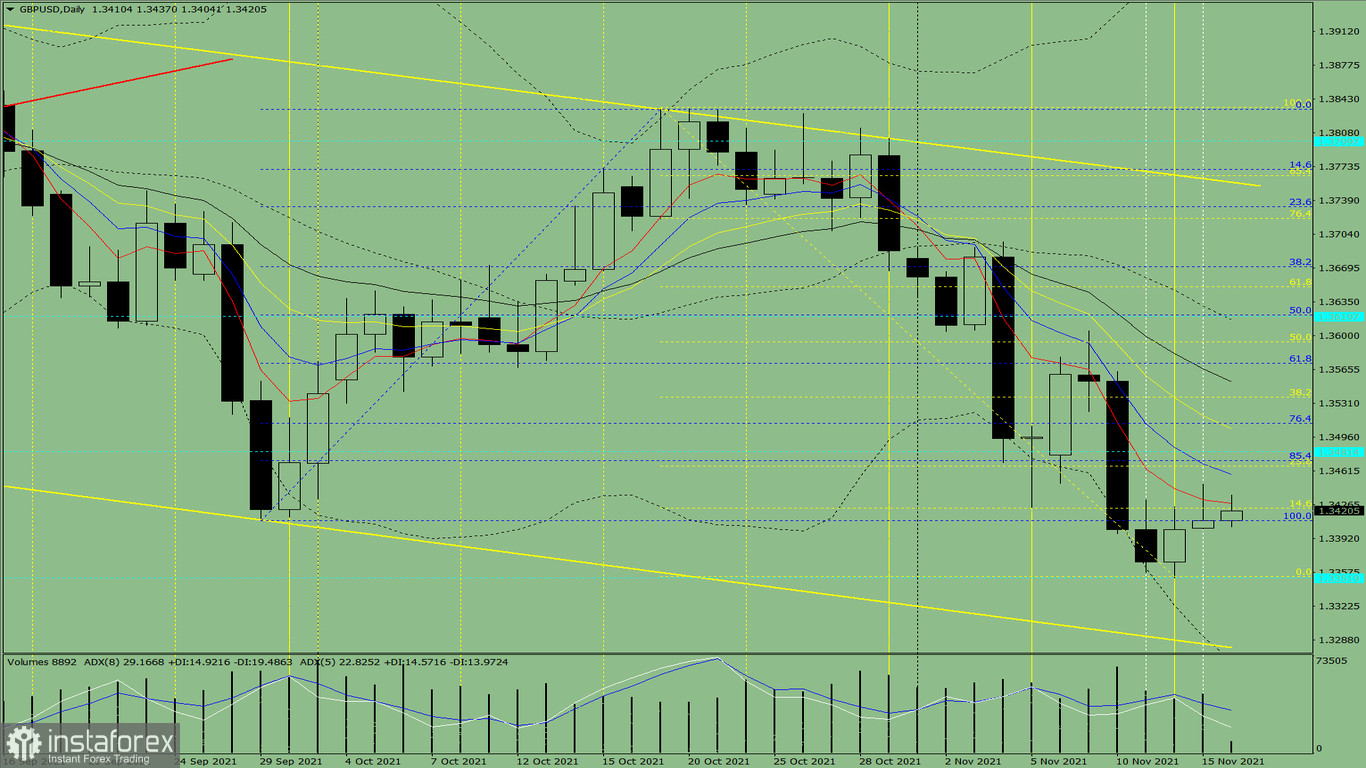
Figure 1 (daily chart)
Comprehensive analysis:
- Indicator analysis - up
- Fibonacci levels - up
- Volumes - up
- Candlestick analysis - up
- Trend analysis - up
- Bollinger lines - up
- Weekly chart - up
General conclusion:
The price from the level of 1.3410 (closing of yesterday's daily candle) will try to continue its growth to the target of 1.3466 – the pullback level of 23.6% (yellow dotted line). After testing it, it can move up higher to the target of 1.3537– the pullback level of 38.2% (yellow dotted line).
As an alternative, the price from the level of 1.3410 (closing of yesterday's daily candle) can resume its decline to the target of 1.3352 – the lower fractal (yellow dashed line) and then rise again to the target of 1.3422 – the pullback level of 14.6% (yellow dotted line).


