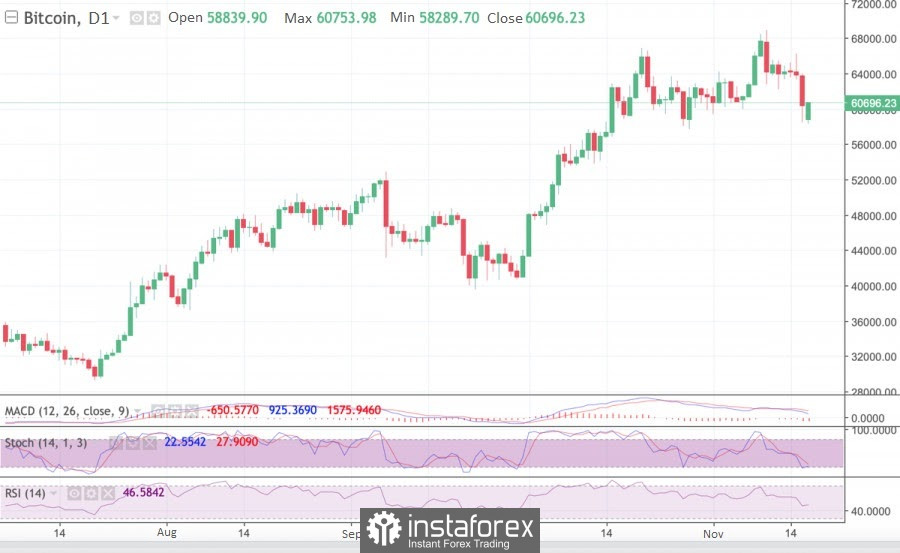
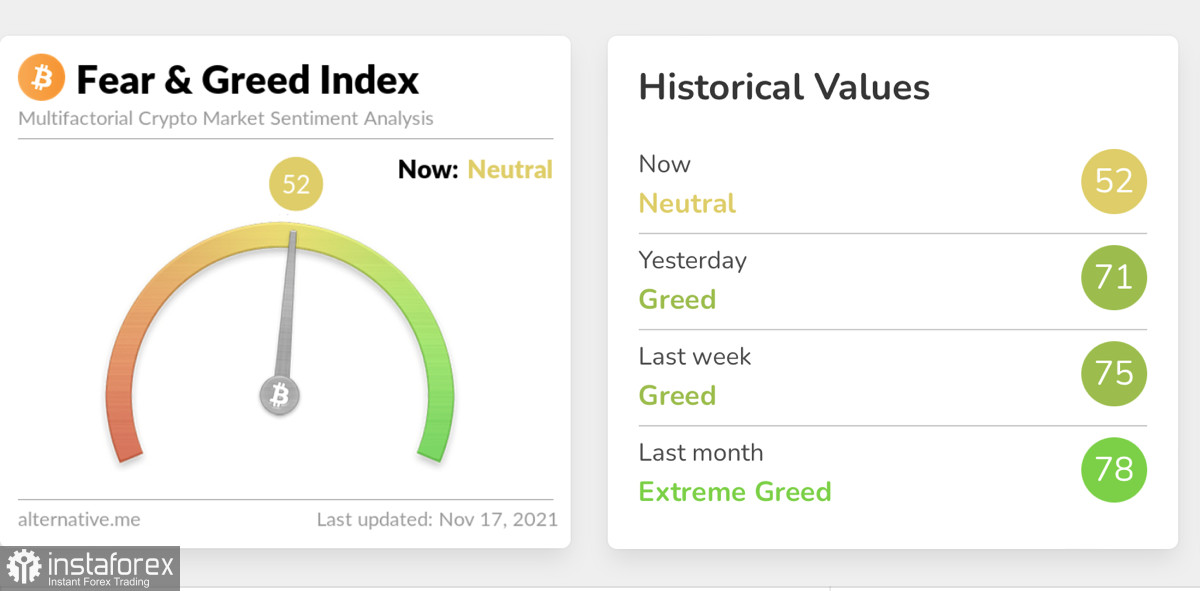
After a promising start to the trading week, bitcoin is approaching its equator under the powerful pressure of a downtrend. At the same time, the fear and greed index is still at 52, there are alarming signals that the market has begun to doubt the ability of the cryptocurrency to continue its upward movement.
In addition to the impulsive decisions of retail traders, there are coin movements by major players, which are a fundamental part of the bullish rally.
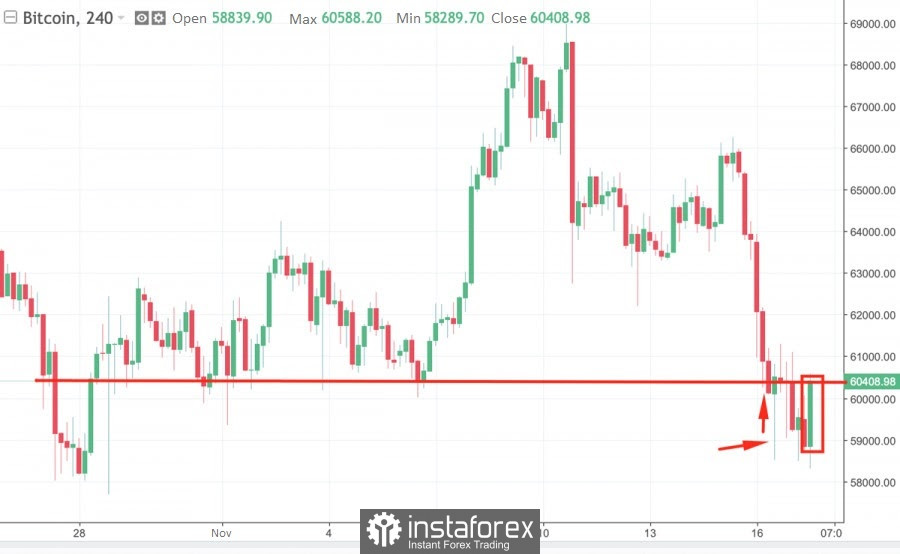
The first important signal to destabilize the situation and the vulnerability of the bulls was the price rebound from the support zone at $58.7k. Then the price managed to defend the $60k milestone, and as a result, the price closed above the opening mark, which was encouraging.
However, according to the results of the previous trading day, bitcoin again reached the $58.7k mark, and this time buying off buyers took much longer and allowed the price to remain under the $60k mark for some time. Subsequently, the quotes of the coin managed to recover due to the formation of a powerful bullish impulse candle on the four-hour chart.
Due to the impulse growth, a bullish engulfing candlestick pattern was formed, but the price slowed down the upward movement near the local resistance zone at $60.4k. This can also be seen as a negative sign, reflecting the weakness of the bulls' positions.
As of 11:00 UTC, the coin is trading around $60.4k and has every chance to go for a second retest of $58.7k.
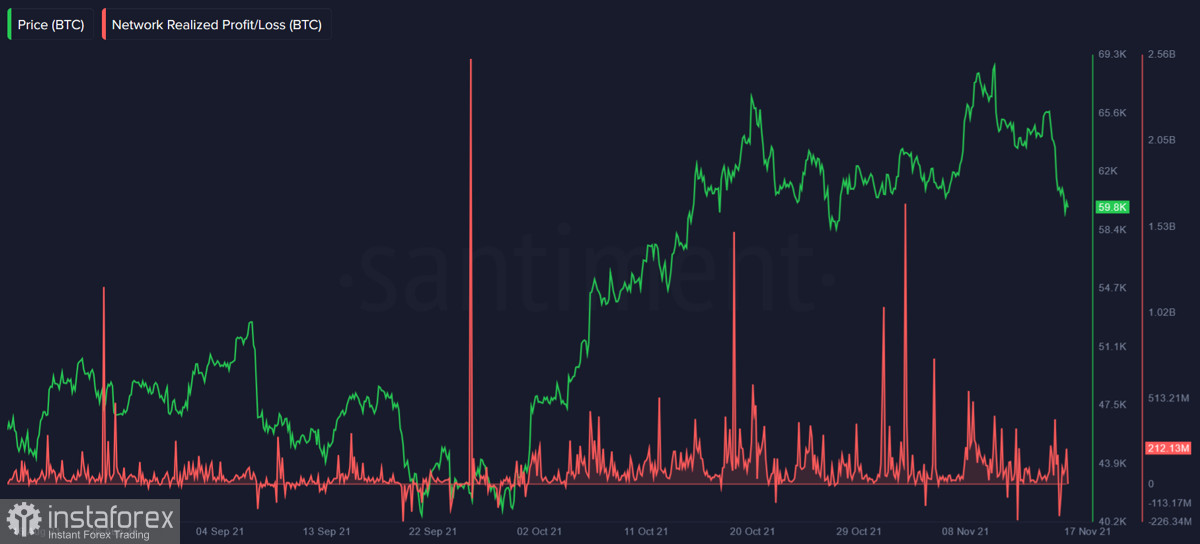
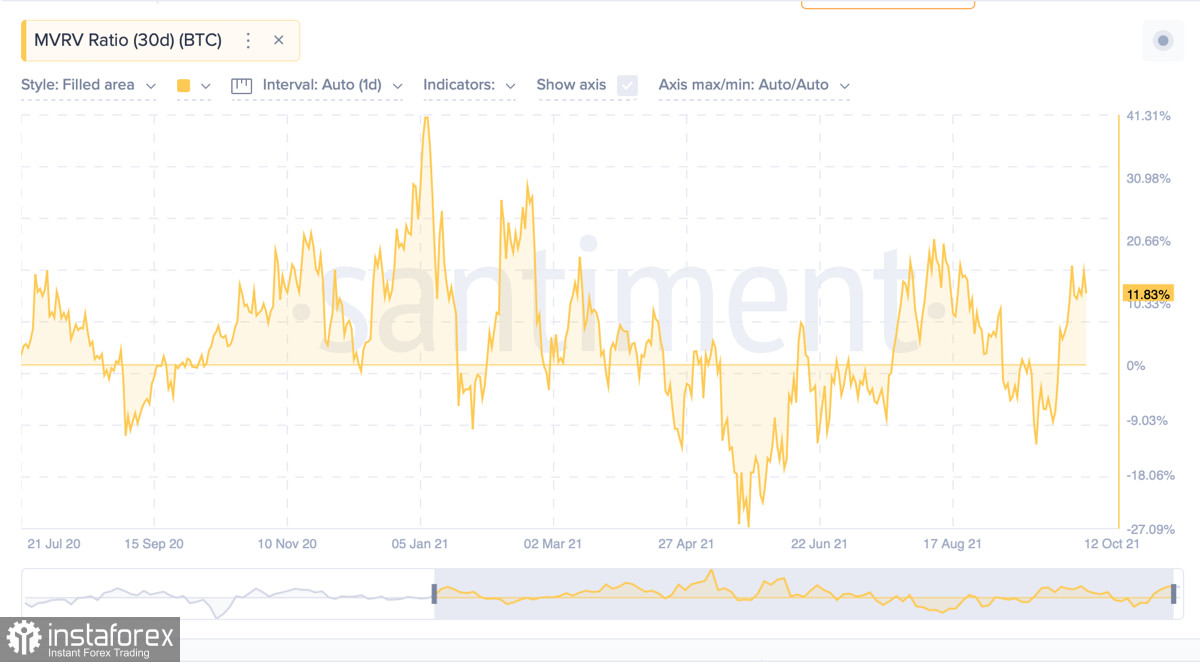
It was the storming of this support zone twice in the last two days that brought confusion to the ranks of investors. Even during the first fall in the price, there were prerequisites for the mass movement of coins at a loss. This is also confirmed by the on-chain metric, the ratio of profit and loss, which at the moment dropped to a negative value, which indicates a panic disposal of stocks.
It is worth noting that such a drop could only confuse short-term investors who entered the asset relatively recently, trying to play on the price increase. In November, there was a similar dynamics of the movement of coins, according to which more than 17% of new capital appeared on the bitcoin market. It was this capital that could not stand it first and began to sell its coins at a loss or with minimal profit, which provoked a further decline in quotes.
The local sale is also confirmed by the metric of the ratio of the market and realized value of the coin, which has made a downward spurt over the past two days, which indicates a sharp increase in the volume of coins sold.
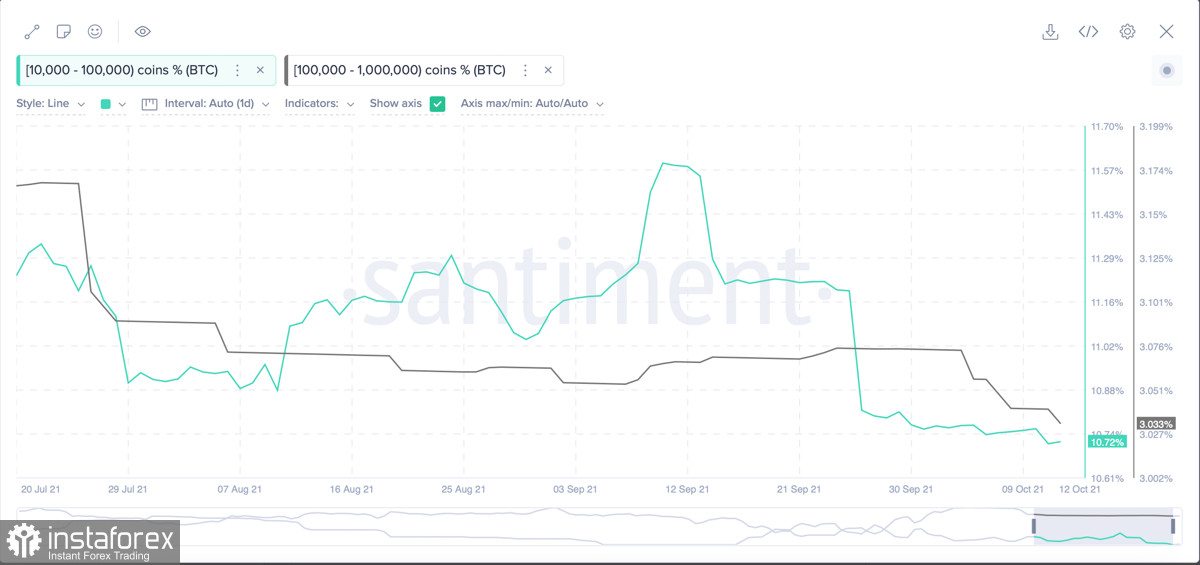
This is also indicated by the analysis of horizontal charts, which states that bitcoin will still collect liquidity in the region of $53.6-$57.8k. Such a frequent retest of the $58.7k mark indicates that it will be broken soon, and therefore bulls should prepare for a massive buy-off near the key support zone of $53.8k.
However, on the daily timeframe, technical indicators indicate a possible start of recovery. Stochastic and the relative strength index have turned around and are moving flat, but the MACD still indicates a downward movement and the strength of bearish pressure.
With a successful movement in the $53.7k-$57.7k zone, the probability of a further rebound above $60k increases markedly, since an increased number of growth orders are concentrated in this area.
In addition, the market is still within the bullish trend and expects further price growth Despite such a deep correction, the $75k mark still looks real by the end of the trading week.
At the same time, it is worth carefully monitoring the market's reaction to the subsequent drop in quotes, since a lot of speculators have entered BTC, which can sharply pull the price. And with a breakdown of $53.8k due to an impulse drop, the question of a possible trend reversal will become a priority.
