


What is needed to open long positions on EUR/USD
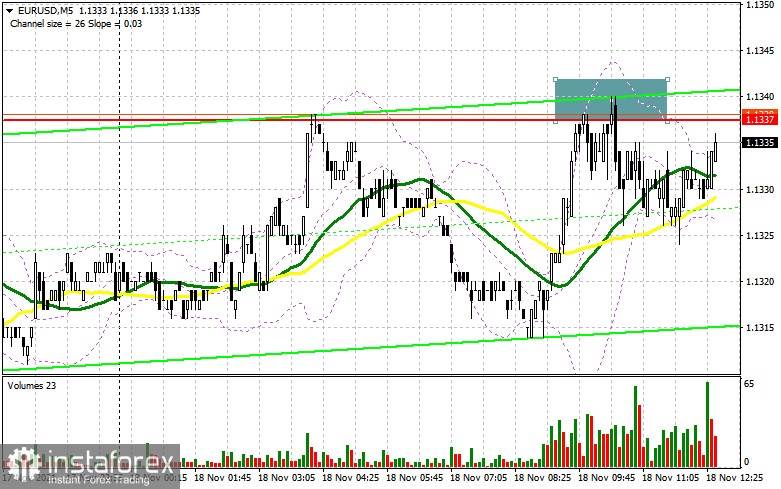
In the morning article, I highlighted the level of 1.1337 and recommended taking decisions with this level in focus. Now let's look at the 5-minute chart and try to figure out what actually has happened. A failed attempt of the bulls to break above 1.1337 set the stage for opening short positions. However, the currency pair did not fall dramatically. EUR/USD declined 15 pips and selling pressure eased afterwards. Then, the bulls carried on pushing the price to the previous level. The lack of fundamental stats in the first half of the trading day is the cause of low volatility. Technically, nothing has changed in the second half of the day.
Apparently, demand for EUR will remain high and we will see a large upward correction. The thing is that fundamental data from the US should trigger this correction. Please don't miss the manufacturing index by the Philadelphia Fed and a weekly update on US unemployment claims. Minor progress in these indicators could escalate pressure on the US dollar. To hold the upper hand in the market, the bulls will have to overcome resistance of 1.1337. This didn't happen in the first half of the day. The test of this level downwards will create the conditions for opening long positions, predicting EUR/USD growth to 1.1372. A breakout in this area and a similar test downwards will generate a new buy signal with the target at 1.1417 where I recommend profit taking.
In the second half of the day, EUR/USD could come under pressure again because FOMC officials John Williams and Mary Daly might drop hints that monetary policy needs hawkish moves. So, I would recommend waiting for a fake breakout at around support of 1.1302. In case the bulls are not active in this area, it would be better not to make hasty decisions but to wait until the price updates a weekly low of 1.1267. Hence, long positions would be appropriate there if the pair fails to settle downwards. We could buy EUR/USD immediately after a bounce off a lower low 1.1222 or from 1.1193, bearing in mind a 15-20 pip intraday correction.
What is needed to open short positions on EUR/USD
The bears asserted strength as they defended resistance of 1.1337 in the first half of the day and created a good market entry point with short positions. However, the market didn't see a massive sell-off of EUR/USD. Trading sentiment will depend on the US economic data in the second half of the day. Only upbeat reports will revive confidence of EUR sellers. This will increase pressure on EUR/USD. Another fake breakout of 1.1337 will suggest opening short positions on EUR/USD following a downtrend. Interim support of 1.1302 is seen as the first target level. If this level is broken and tested upwards, the currency pair will come under more pressure that will activate some stop losses of the buyers anticipating a correction in the short term. This will open the door to lower lows: 1.1267 and 1.1222 where I recommend profit taking on short positions.
If EUR grows in the American session and the bears lack activity at around 1.1337, I would advise you to cancel selling there after a fake breakout. The most sensible solution to sell EUR/USD would be selling straight after a drop off the highs at 1.1417. Don't forget to allow for a 15-20 pip intraday correction.
The COT report dated November 9 logs a decrease of short positions and a modest rise of long positions that revived the positive delta. The fact of high inflationary pressure in the US still props up the US dollar. A lot of investors anticipate that the Fed will raise interest rates ahead of time, i.e. in the mid-summer 2022. This event has been already priced in, so investors are buying the US dollar, betting on its strength. Recent comments from Fed officials confirm the market expectations.
At the same time, ECB President Christine Lagarde is confident that ultra-loose monetary should not be fine-tuned next year. She has reiterated this stance. The dovish rhetoric is putting pressure on buyers of risky assets who expected EUR's robust recovery. Later today, we will get to know US retail sales data and an unemployment rate for the Eurozone. These metrics will shed light on further policy moves of the regulators to support the economy. The last COT report reads that the number of long non-commercial positions grew from 191,496 to 192,544. On the other hand, the number of short non-commercial positions declined from 197,634 to 188,771. The overall non-commercial net positions turned positive to 3,773 against -6,138.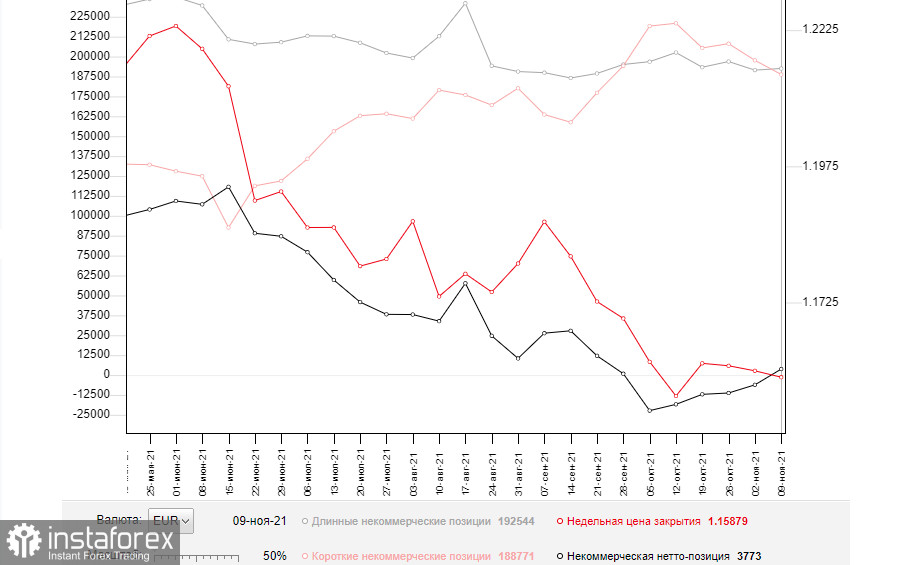
Signals of technical indicators
Moving averages
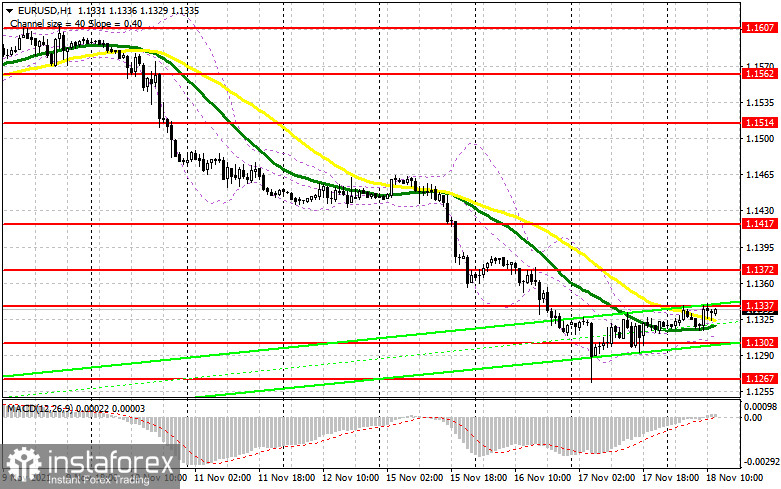
EUR/USD is trading slightly above 30- and 50-period moving averages. It means that the bulls don't give up attempts to carry on with an upward correction.
Remark. The author is analyzing a period and prices of moving averages on the 1-hour chart. So, it differs from the common definition of classic daily moving averages on the daily chart.
Bollinger Bands
A breakout of the upper border at about 1.1337 will trigger a new bullish wave of EUR. Alternatively, a breakout of the lower border at about 1.1305 will escalate pressure on EUR/USD.
Definitions of technical indicators
- Moving average recognizes an ongoing trend through leveling out volatility and market noise. A 50-period moving average is plotted yellow on the chart.
- Moving average identifies an ongoing trend through leveling out volatility and market noise. A 30-period moving average is displayed as the green line.
- MACD indicator represents a relationship between two moving averages that is a ratio of Moving Average Convergence/Divergence. The MACD is calculated by subtracting the 26-period Exponential Moving Average (EMA) from the 12-period EMA. A 9-day EMA of the MACD called the "signal line".
- Bollinger Bands is a momentum indicator. The upper and lower bands are typically 2 standard deviations +/- from a 20-day simple moving average.
- Non-commercial traders - speculators such as retail traders, hedge funds and large institutions who use the futures market for speculative purposes and meet certain requirements.
- Non-commercial long positions represent the total long open position of non-commercial traders.
- Non-commercial short positions represent the total short open position of non-commercial traders.
- The overall non-commercial net position balance is the difference between short and long positions of non-commercial traders.


