


Daily
_source!.png)
GBP / USD was in a downside movement from 1.6745 down to 1.6057 which limited the downside movement
It's important to notice that 1.6057 is the Fibonatcci 50% of the upside movement marked in the chart
Since then the pair has been moving in a flag pattern which is a continuation pattern by the way .
25 May there was a daily closure above the flag channel giving the signal to go long
We see strong full body bullish candle for yesterday indicating pressure of buying
The currency pair formed the candlestick formation " Three White Soldiers" at Level 50% Fibonatcci ( 1.6057 ) indicating strong upside movemet to come next .
4H
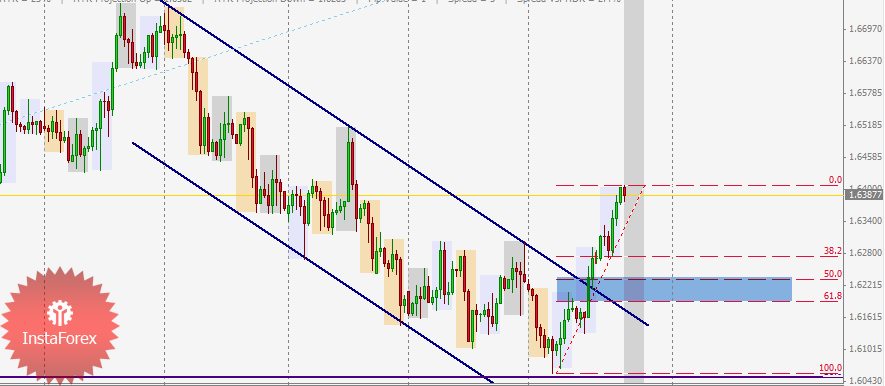
The inverted head and shoulder pattern seems to be successful in reversing the downside movement till now
As we said before breakout of the bearish channel gave a good opportunity to go long to benefit from the initial movement
now we have two probabilities either it continues going upside or go through some retracement which we will use to open long positions .
Trade Recommendations :
The buy signal came after breakout of the channel .
But for those who missed this trade they have the best area to buy the pair is at 1.6230 - 1.6190 ( retest of the upper limit of the channel ) with initial target at 1.6400 then 1.6500 as next target
SL should be below 1.6050 ( 50% Fibonatcci ) of the long term swing up .


