Bulls have a harder task than their opponents
Hello, dear traders!
On the last day of the trading week, let's analyze the AUD/USD charts.
Weekly chart

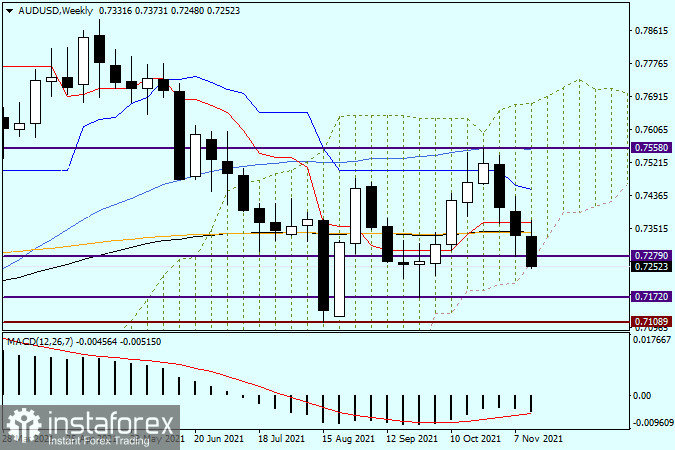
On the weekly chart, the Australian dollar is traded lower versus the greenback. The instrument was bullish in the previous four trading days as well. AUD bulls, trying to regain control of the market, encountered strong resistance in the range of 0.7340-0.7365 from the black EMA (89) and the orange EMA (200), as well as the red Tenkan-Sen of the Ichimoku indicator. If the price fails to break these levels, the uptrend on AUD/USD is unlikely to resume. At the same time, the strong and important resistance levels of 0.7172 and 0.7106, as well as the psychological barrier of 0.7000, have not been broken yet. These marks have previously provided the pair with good support, according to the chart.
AUD bears are highly likely to test the above-mentioned support levels. Nevertheless, they are expected to test them already next week. At the moment, the price is attempting to leave the boundaries of the Ichimoku Cloud. If the price closes below the Cloud's lower border on Friday, pressure on the pair will increase, and it will more likely drop to the above-mentioned levels. The uptrend in the market will begin in case the quote goes above the EMA (89) and EMA (200), as well as breaks above the red Tenkan-Sen and tests the strong resistance level of 0.7558. The uptrend will be confirmed as soon as the price leaves the boundaries of the Ichimoku Cloud. So, bulls have a harder task than their opponents.
Daily chart

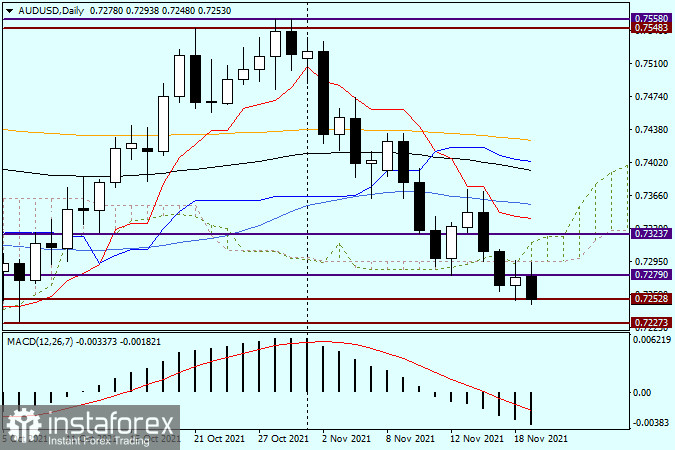
Meanwhile, the daily chart indicates bearish movement. The pair is below both boundaries of the daily Cloud. It was rebounding to them in the past two days, allowing traders to go short. Today, a rebound was limited by the 0.7293 barrier. The price encountered strong resistance there and reversed downward. At the time of writing, the downtrend was accelerating. Nevertheless, the pair has not updated yesterday's low of 0.7252 yet. Until there is a breakout of this barrier, the price is unlikely to go further down. Due to the pair's proximity to the support levels of 0.7252 and 0.7227, despite bearish market sentiment, traders should refrain from opening short positions at the moment. In case of a breakout of support at 0.7252 on lower time frames, traders could consider opening short positions with modest targets. Anyway, it is important to remember that the next support level of 0.7227 is located in close proximity. If bearish candlestick patterns occur above 0.7252 and/or 0.7227 on the H4 or H1 charts, traders could try to purchase AUD with modest targets of 20-30 pips.
Have a nice weekend!


