Wave pattern
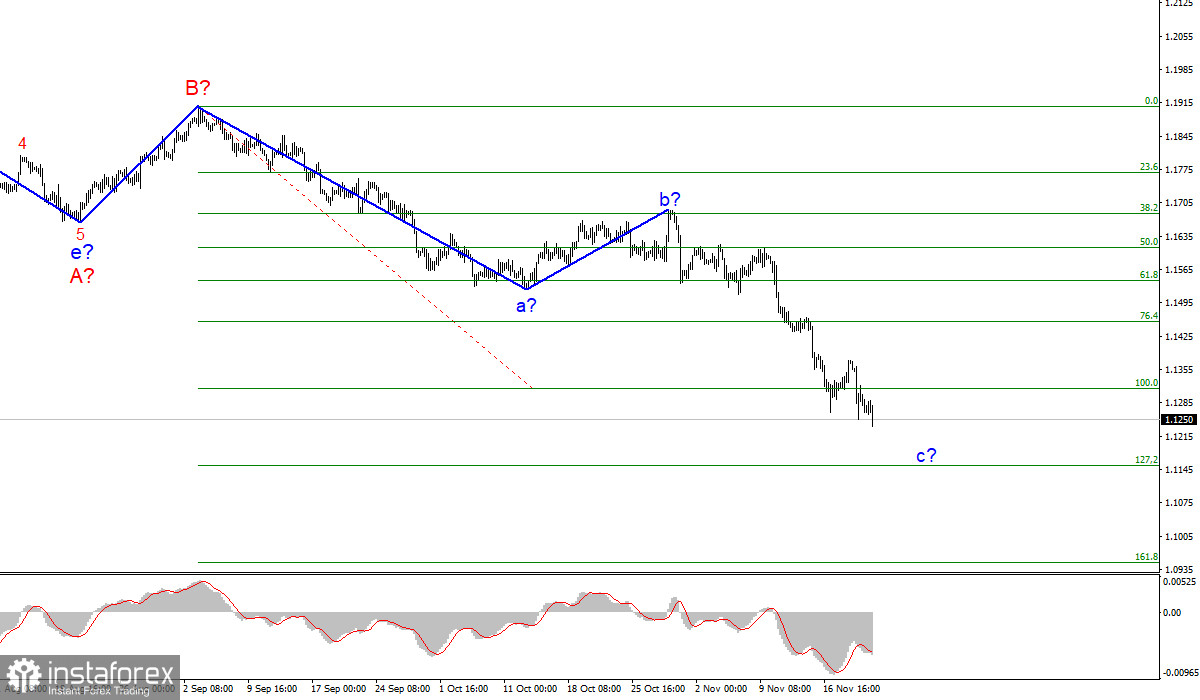
The wave layout for EUR/USD on the 4-hour chart remains complete. The a-b-c-d-e section of the trend, which was formed at the very beginning of the year, should be interpreted as wave A, and the subsequent rise in the instrument is seen as a wave B. Thus, the formation of the assumed wave C continues and it can also take a very extended form. If the current wave counting is correct, then the construction of the supposed wave c in C is in progress. The entire C wave may turn out to have a five-wave structure. The targets are located near the estimated mark of 1.1153 which corresponds to 127.2% Fibonacci. This wave, however, may take on a longer form with a target around 1.0949, which corresponds to 161.8% Fibonacci. A successful attempt to break through the 1.1314 level will indicate that markets are ready for more sales of the instrument. A failed attempt to break through the 1.1153 mark could signal the end of wave c in C.
USD may well advance towards 1.1150
On Friday, the news background for the EUR/USD pair was rather weak in some aspects, but important at the same time. No economic reports were published that day, but ECB President Christine Lagarde and US Treasury Secretary Janet Yellen made statements. I cannot say that their speeches had any strong influence on the foreign exchange market. Yet, I should admit that the decline in the instrument has clearly intensified lately. Therefore, Christine Lagarde's speech may be partly to blame for this. The President of the ECB announced that the central bank was not going to take measures against high inflation, as it considered it temporary. In addition, the ECB is not yet ready to raise the key rate, and the difficult situation around the coronavirus in Europe may require an extension of the stimulus measures for the economy. So I don't think that the PEPP program will end in March 2022. Or, instead, the regular incentive program will not be immediately expanded by the same amount the PEPP program will be reduced. In general, the ECB is likely to maintain its dovish stance on the monetary policy as it thinks that the EU economy is not yet ready for tightening. This is why the euro can be seriously pressured by the dollar. After all, the Fed has already begun to reduce its QE program, and many analysts are sure that next year the interest rate will be raised at least once. Besides, the current wave structure indicates the construction of a downtrend section. All these factors prompt the demand for the US currency.
Conclusion
Based on the analysis above, I can conclude that the construction of the descending wave C will continue. Therefore, I will advise you to sell the instrument following each sell signal from the MACD indicator with targets located near the estimated level of 1.1153, which corresponds to 127.2% Fibonacci.

Higher time frame
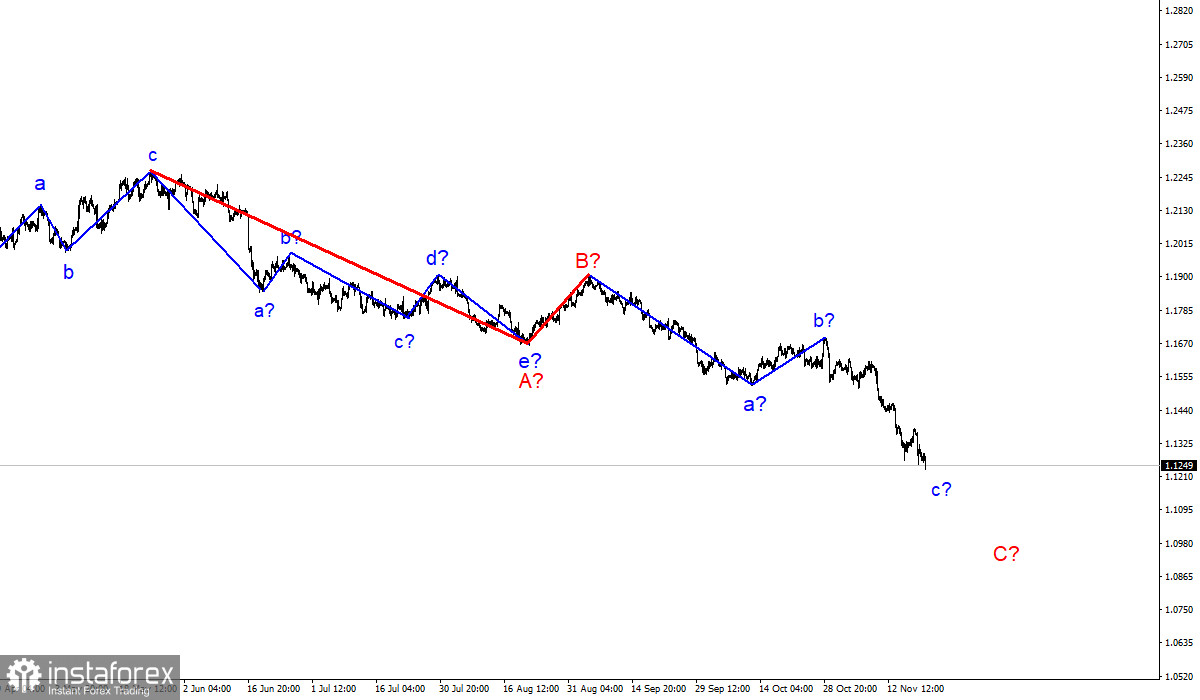
The wave layout on the higher time frame looks quite convincing. The quotes continue to move lower. The descending section of the trend that was initiated on May 25 takes the form of a three-wave correctional pattern A-B-C. This means that the downtrend may continue for another month or two until the wave C is fully completed. It can have either a three- or a five-wave structure.


