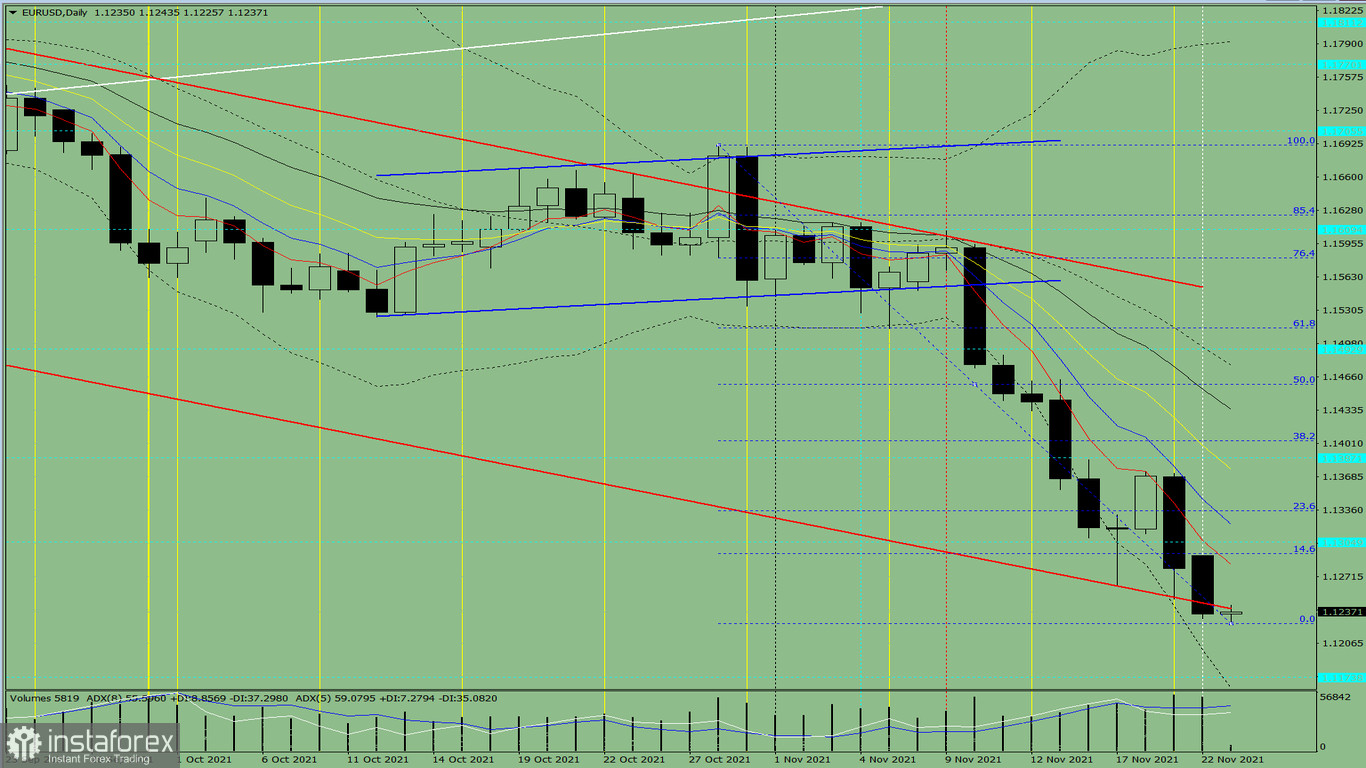
Trend analysis (pic. 1).
On Tuesday, the market will try to reach a pullback level of 14.6% – 1.1294 (blue dotted line) from the level of 1.1239 (closing of yesterday's daily candlestick). It will attempt to resume an upward movement. If so, it may approach the target level of 1.1336 - the retracement level of 23.6% (blue dotted line).

Pic. 1 (daily chart).
Complex analysis:
- indicator analysis – up;
- Fibonacci retracement levels - up;
- volumes - up;
- candlestick analysis - up;
- trend analysis - up;
- Bollinger lines - up;
- weekly chart - up.
Conclusion:
Today, the price is rising in an attempt to reach the retracement level of 14.6% - 1.1294 (blue dotted line) from the level of 1.1239 (closing of yesterday's daily candle). It is likely to approach the target level of 1.1336 - the retracement level of 23.6% (blue dotted line).
An unlikely scenario is that the price may try to decline to the target level of 1.1174, the historical support level (blue dotted line) from the level of 1.1239 (the closing of yesterday's daily candle). Having tested this level, the price may grow to the target level of 1.1240 - the resistance level (red bold line).


