


Trend analysis (Fig. 1)
GBP / USD will continue moving down today from 1.3392 (closing of yesterday's daily candle) to the lower fractal (yellow dashed line) - 1.3352. Then, it will bounce back and head to 1.3423, which is the 14.6% retracement level (yellow dashed line).
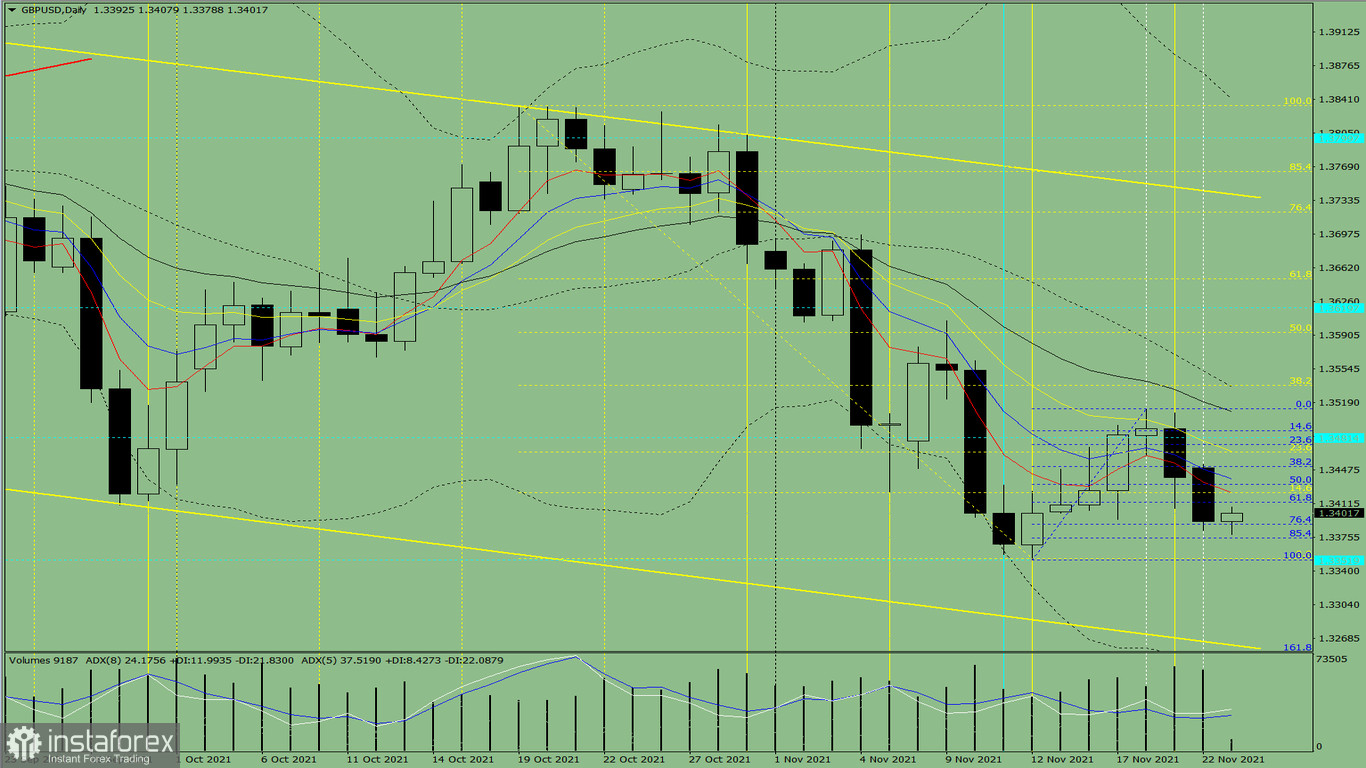
Fig. 1 (daily chart)
Comprehensive analysis:
- Indicator analysis - uptrend;
- Fibonacci levels - uptrend;
- Volumes - uptrend;
- Candlestick analysis - uptrend;
- Trend analysis - uptrend;
- Bollinger bands - uptrend;
- Weekly chart - uptrend.
Conclusion: GBP / USD will decline from 1.3392 (closing of yesterday's daily candle) to the lower fractal (yellow dashed line) - 1.3352. Afterwards, it will go up to 1.3423, which is the 14.6% retracement level (yellow dashed line).
That being said, there is little chance that the pair will drop from 1.3392 (the close of yesterday's daily candle) to the lower fractal (yellow dashed line) 1.3352, and then continue going down to the support line (yellow bold line) - 1.3262.


