


Trend analysis (Fig. 1)
The price from the level of 1.3318 (closing of yesterday's daily candle) will make an attempt to start rising today to the target of 1.3352 – the historical resistance level (blue dotted line). After this level is tested, it may further rise to the target of 1.3383 – the pullback level of 50.0% (blue dotted line).
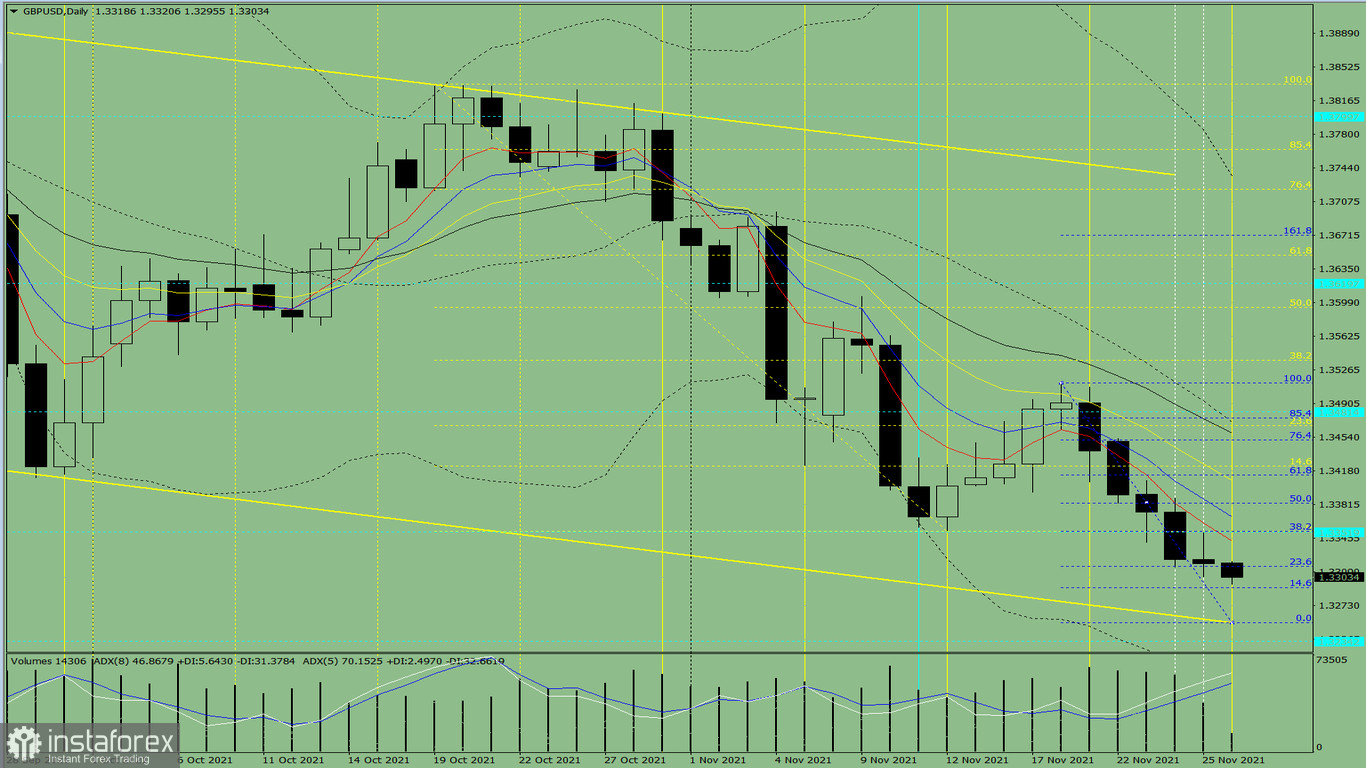
Figure 1 (daily chart)
Comprehensive analysis:
- Indicator analysis - up
- Fibonacci levels - up
- Volumes - up
- Candlestick analysis - up
- Trend analysis - up
- Bollinger lines - up
- Weekly chart - up
General conclusion:
Today, the price from the level of 1.3318 (closing of yesterday's daily candle) will try to start increasing to the target of 1.3352 – the historical resistance level (blue dotted line). After testing it, the upward movement may continue to the target of 1.3383 – the pullback level of 50.0% (blue dotted line).
Alternatively, the price from the level of 1.3318 (closing of yesterday's daily candle) will try to continue declining to the target of 1.3252 – the support line (yellow bold line). After testing this line, the price may start growing to the target of 1.3292 – the pullback level of 14.6% (blue dotted line).


