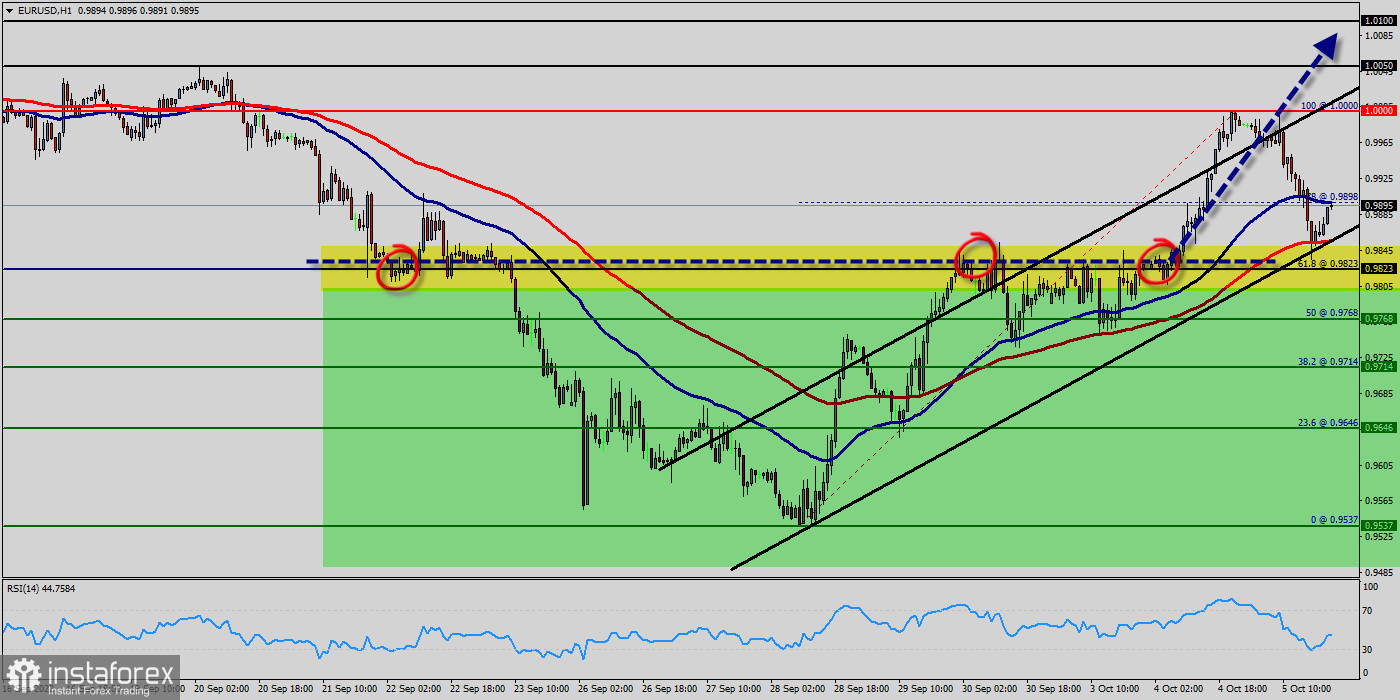
The EUR/USD pair faced a minor resistance at the level of 1 USD, while major resistance is seen at 1.0100. Support is found at the levels of 0.9823 and 0.9768. Also, it should be noted that a daily pivot point has already set at the level of 0.9823.
Equally important, the EUR/USD pair is still moving around the key level at 0.9900, which represents a daily top in the H1 time frame at the moment. The EUR/USD pair will continue rising from the level of 0.9901 in the long term. It should be noted that the support is established at the level of 0.9823 which represents the daily pivot point.
Yesterday, the EUR/USD pair continued to move upwards from the level of 0.9768. The pair rose from the level of 0.9768 to the top around 1 USD. However, the trend rebounded from the top point of 1 USD to close at 0.9900.
The level of 0.9823 is expected to act as major support today. According to the previous events, the EUR/USD pair is still moving between the levels of 0.9823 and 1 USD.
Therefore, we expect a range of 177 pips in coming two days. The trend is still above the 100 EMA for that the bullish outlook remains the same as long as the 100 EMA is headed to the upside. But, the price spot of 0.9823 remains a significant support zone.
Since the trend is above the last bearish wave, the market is still in an uptrend. Overall, we still prefer the bullish scenario. Consequently, there is a possibility that the EUR/USD pair will move upside.
The structure of scaling does not look corrective. In order to indicate a bullish opportunity above the area of 0.9823, buy above the price of 0.9823 with the first target at 1USD (double top).
Yesterday, the EUR/USD pair has broken resistance at the level of 0.9823 which acts as support now. Thus, the pair has already formed minor support at 0.9823.
The strong support is seen at the level of 0.9768 because it represents the weekly support 1. Technical readings in the daily chart favor a bullish continuation, as indicators maintain their firmly bullish slopes within positive levels, while the 100 MA heads firmly higher below the current level. Equally important, the RSI and the moving average (100) are still calling for an uptrend.
Therefore, the market indicates a bullish opportunity at the level of 0.9823 in the H1 chart. Also, if the trend is buoyant, then the currency pair strength will be defined as following: EUR is in an uptrend and USD is in a downtrend. Buy above the minor support of 0.9823 (this price is coinciding with the ratio of 61.8% Fibonacci) with the first target at 1 USD, and continue towards 1.0050 (the weekly resistance 2). Next objective will target at 1.0100.
On the other hand, if the price closes below the minor support (0.9823), the best location for the stop loss order is seen below 0.9823; hence, the price will fall into the bearish market in order to go further towards the strong support at 0.9768to test it again. Furthermore, the level of 0.9537 will form a double bottom.
On the downside, break of 0.9768 minor support will suggest that such rebound has completed and bring retest of 0.9537 low instead.


