


Bitcoin closed the session in November with an uncertain bearish candlestick that does not change anything on the global scale. On the contrary, bears failed to reverse the uptrend after the formation of the bullish engulfing pattern of September-November 2021. Therefore, the cryptocurrency is currently holding within the uptrend, but the situation remains tense. The main reason for concern is the inability of BTC to settle above $60,000 after a pullback from the area of $54,000-$56,500. As long as the asset remains in this zone, it is likely to decline towards $53,000.
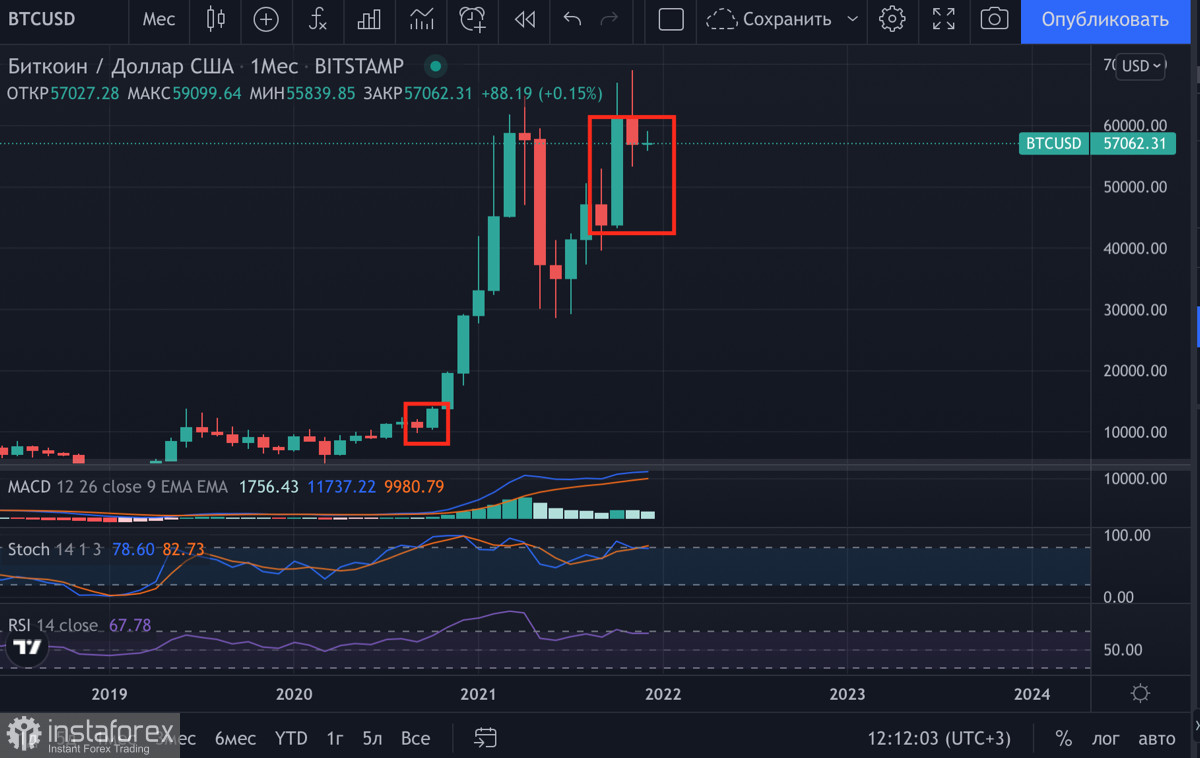
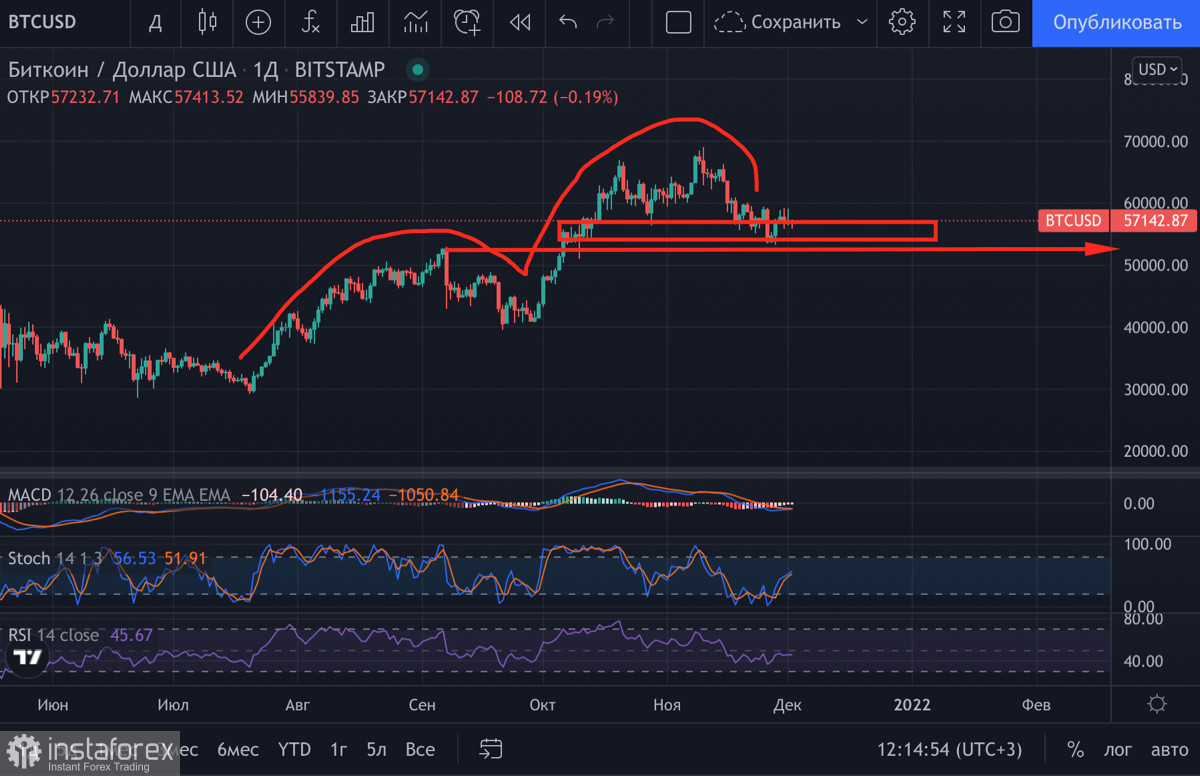
The level of $53,000 remains a strong obstacle: its breakout increases the likelihood of the mid-term trend reversal. This is because the high of the previous ascending wave is located in the $53,000 area. Therefore, its downward breakout is considered a bearish sign. In order to define when the price will be able to move above the area of $60,000 and consolidate there, we need to analyze smaller time frames. This is where local technical patterns can show the probability of the price going beyond $60,000.
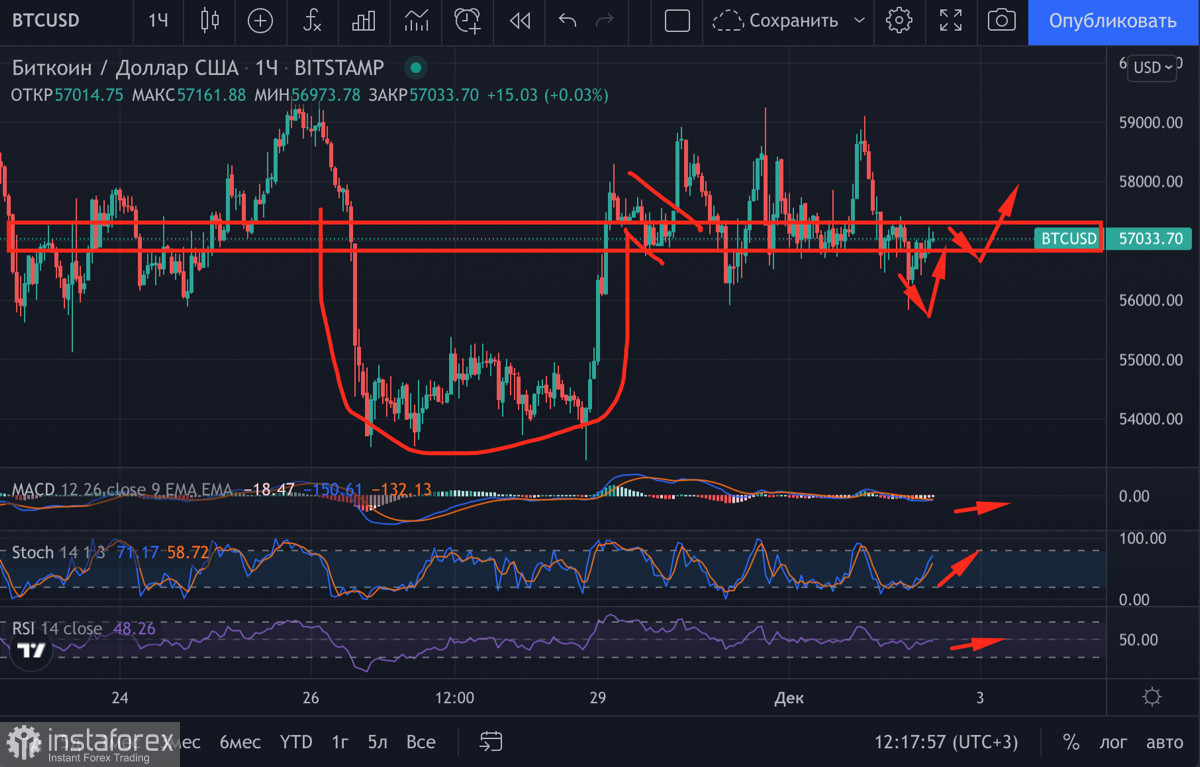
On the hourly chart, we can see that the price is consolidating near the final resistance zone. Its breakout will enable the price to move above $60,000. Technical indicators are demonstrating clear upward dynamics, which ensures a successful retest of this zone. However, in addition to this, we can see that a Cup and Handle technical pattern being formed on the chart. This is a bullish pattern which indicates growth. The upside potential of the pattern is around the $61,500 level, which is another supporting factor signaling an exit from the range of $56,000-$58,700.
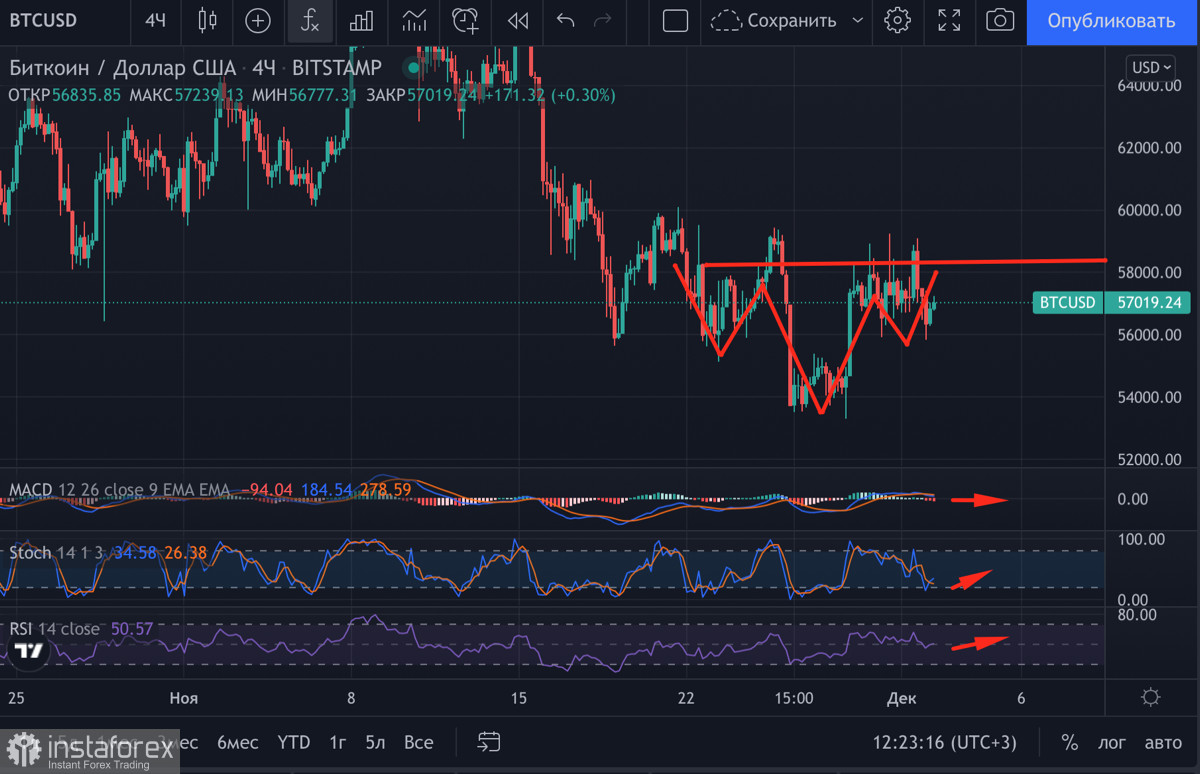
On the four-hour chart, there is also an important technical pattern called Head and Shoulders which indicate a trend reversal. In our case, this means that the price is about to change its downward direction and start rising, which is also a bullish signal. The growth potential of this formation is also determined by the level of shoulders (horizontal line on the chart) which is the level of $60,000. The analysis of technical patterns on smaller time frames helps us determine the upcoming price movements on a larger scale.
Consolidation above $60,000 will raise the confidence of institutional investors in the future growth of the coin. Over the past two weeks, the accumulation rate of crypto whales has noticeably decreased compared to the same period in early November. This indicates the uncertainty of some investors in bitcoin's future uptrend. The news about the accelerating wrap-up of the US assets purchases program deteriorated the market sentiment as bitcoin was largely supported by it. However, the cryptocurrency demonstrated strong resilience by bouncing into the area of $57,000-$60,000. To build confidence in bitcoin's future rally, the price needs to gain a foothold above $60,000.


